Asset Owners / Insights
CIO Quarterly: Crystalizing Institutional Investor Asset Allocations & Comparative Portfolio Returns
Q3 2024

The recent investment landscape has been riddled by decades-high inflation which drove an aggressive tightening in global monetary policy, ongoing geopolitical threats, and, now, concerns around an economic slowdown and the implications of a pivot in monetary policy. Consequently, institutional investors—specifically, pension funds—have had to navigate these dynamics while maintaining their strategic goals over the longer-term against the headwinds of an unfolding demographic shift in which more than 11,000 Americans are turning 65 years old every day. For pension funds, asset allocation, investment selection, and overall expected portfolio returns only become more important as they seek to meet the obligations of their plans’ participants.
In the previous Asset Owner CIO Quarterly, we explored asset allocation insights from the Nasdaq eVestment platform in addition to risk modeling capabilities that can further inform investors for a holistic asset allocation strategy. As a continuation of these themes, in this Quarterly, we discuss asset owner performance and asset allocation trends, drilling down into private debt allocations and manager rosters, and investors’ relative performance–made possible using Nasdaq eVestment Peer Benchmarking and Market Lens.
Key Takeaways
Download a copy of the report here.
To begin, we review preliminary Q2 2024 U.S. public funds median total portfolio performance data from Nasdaq eVestment Peer Benchmarking. The below Peer Benchmarking Dashboard highlights median and top/bottom quartile annualized trailing performance as of June 30, 2024, across all U.S. public funds. At the time of writing, Peer Benchmarking includes 225 universe observations for 1-year trailing performance as of Q2 2024, representing roughly two-thirds of reporting U.S. public funds.

U.S. public funds enjoyed relatively solid one-year annualized total portfolio returns as of Q2 2024, with median performance at around 9.7% and the top 5% of performers coming in just below a 13% return. The bottom 5% of U.S. public fund achieved respectable returns of 7% to 7.25%, arriving at the frequently assumed rate of return amongst U.S. public funds of approximately 7%.
Performance on longer time horizons, however, were impacted by a changing inflation regime and the shock of COVID-19. Median three-year performance came in at around 3.2%, while even the top performing investor failed to hit a 6% annualized return. Meanwhile, the bottom performers barely saw any growth over the period with annualized returns barely over 1%. Five-year and ten-year annualized returns were better overall with the range of performance across plans contracting and shifting toward the assumed rate of return.
With asset allocation, performance, and manager roster relationships sourced from Nasdaq eVestment Peer Benchmarking for Asset Owners, we can identify top performing institutional investors by total portfolio and asset class returns, compare their asset allocations, and drill down to see the exact manager roster relationships powering their programs.
The asset allocation chart below is sourced from a Nasdaq eVestment Peer Benchmarking Dashboard, calculated bottom-up from identified manager roster relationships. The plot points represent the top ten U.S. public funds with over $10 billion in total AUM by three-year total portfolio performance as of year-end 2023. The quartile and percentile rank and bars are calculated based on a universe of all U.S. public funds with over $10 billion in AUM.

Higher private markets allocations and relatively low equity and fixed income allocations versus peers immediately stand out amongst the top performing large funds. Nine of the top ten rank below the median for equity allocations (below 39.1% of total fund), and six out of the top ten rank in the bottom quartile (below 26.3%) amongst U.S. public funds in the broader sample set. In the same vein, all of the top ten rank below the median (roughly 20%) fixed income allocations and only two of ten maintain multi-asset allocations.
Instead, top performing large funds have sought outperformance through greater private markets allocations. Eight of the top ten ranked above the median in private equity allocations (over 16.7%). While the median private debt allocation across all $10+ billion U.S. public funds is just under 5%, two of the top ten have allocated over 20% of their portfolios to private debt, embracing an idiosyncratic approach to arrive at top performance. Real estate allocations among outperforming large funds similarly lie above the median program’s allocation primarily oriented toward non-core real estate investments. All of the top ten allocate to private infrastructure, although multiple plans have only recently begun their programs with sub-1% allocations to the asset class.
Different paths to outperformance emerge amongst top performing $1 billion to $10 billion U.S. public funds, with more varied allocations and higher public markets allocations than their $10+ billion AUM peers as shown in the chart below.

Four of the top ten are at or above the median public equity allocation, with one investor achieving a top spot with a near 60% public equity allocation and no private equity allocation. Similarly, fixed income allocations ranged and only eight of the top ten maintain a dedicated private debt allocation. Real estate allocations among top performing smaller funds ranged from top to bottom quartile as well, with programs less concentrated in non-core real estate than their larger peers. Three of the top ten have yet to allocate to infrastructure, but five of the top ten already maintain top quartile allocations to the inflation-minded asset class.
With Nasdaq eVestment Peer Benchmarking Dashboards, we can further research these top performing U.S. public fund, identifying the exact manager roster relationships driving their outperformance.


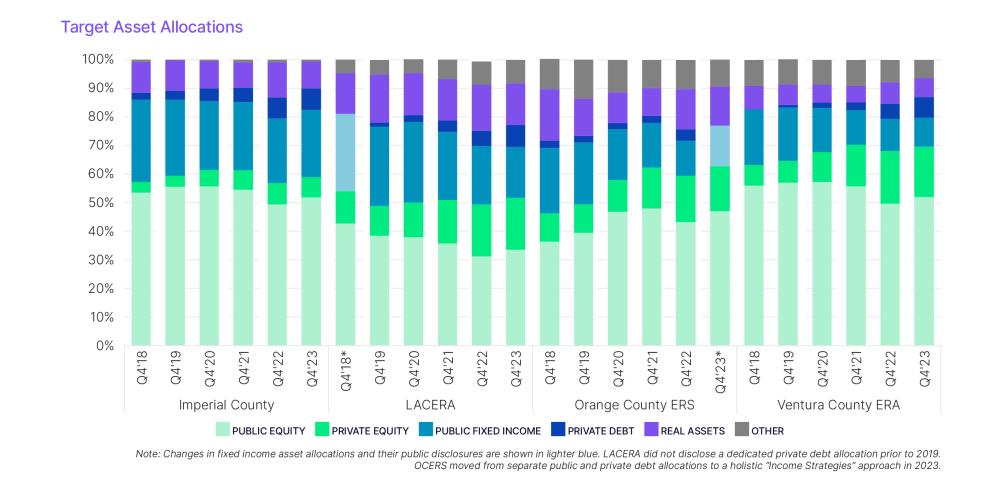
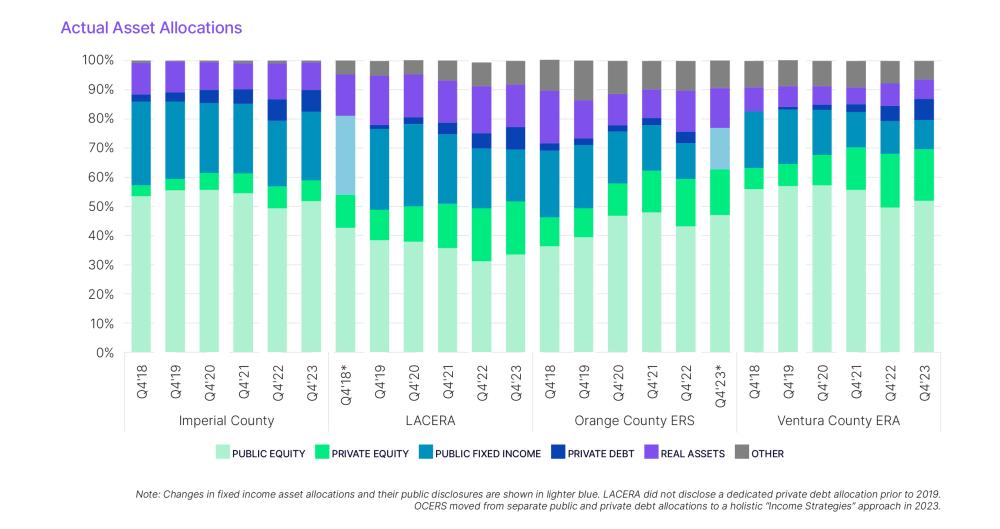
As a proxy for the trends in asset allocation shifts amongst institutional investors over the past five years, we analyzed four well-known California county pension plans as a sample set: Imperial County Employees’ Retirement Services (ICERS), Los Angeles County Employees Retirement Association (LACERA), Orange County Employee Retirement System (OCERS), and Ventura County Employees’ Retirement Association (VCERA), which have a combined $110 billion in assets. The charts below show target allocations and current allocations across both public and private asset classes.
Target allocation trends ranged from ICERS maintaining relatively steady allocation targets from Q4 2018 to Q4 2023 to the remaining three, larger-by-AUM plans exhibiting more deliberate shifts. A common theme amongst those three plans was a reduction in public market target allocations—particularly in fixed income—and increases of varying degrees in private equity and private debt. Perhaps counter intuitive to a macro backdrop with elevated inflation over the past three years, real asset target allocations ranged from flat to down.

Now, while institutional investors may adjust their target allocations, the time it takes to achieve those targets with their actual allocations can vary on account of market dynamics, capital deployment speed, and asset manager selection, amongst other reasons. Furthermore, the incorporation of new asset classes are studied and vetted alongside consultants. Among the four California county plans, Meketa, NEPC, and Verus were represented as general consultants and Albourne as Illiquid Credit consultant for LACERA. Aksia, StepStone, Townsend, and Abbott Capital are additionally retained as specialist consultants but not for Private Debt.

Another advantage of Peer Benchmarking is the ability to analyze institutional investors’ performance relative to peers—whether it be total portfolio performance, by specific asset classes, or relative to specific peer groups.
Continuing with the aforementioned California-based plans, the chart below shows the sample set of these four plans’ total portfolio performance across all asset classes on one-, three-, and five-year horizons relative to the total performance for a universe of all U.S. public funds with over $1 billion in assets (345 investors). VCERA is the top performing plan on a one- and five year basis, while LACERA led this group on a three-year horizon. In all cases, the top performing California plans were above the top quartile of the broader universe and, impressively, there were multiple plans performing in the top quartile relative to the broader universe of peers on three and five-year horizons. If looking for commonalities amongst the top performing plans across the three time horizons, as discussed in the prior section, VCERA and LACERA have both reduced their public equity and public fixed income current allocations, while notably increasing their private equity and private debt exposures.

And, given this theme of institutional investors increasing exposures to private markets, if drilling down further to focus on private debt-specific returns for these four plans relative to those 85 investors with unique private debt programs at U.S. public funds, LACERA is the top performer on a one- and three-year basis, while ICERS is the top performer on a five-year basis (note: LACERA does not have a performance metric for the five-year period). On a one-year basis, LACERA’s private debt returns were an impressive 13.4% versus 11% for the top quartile and 9.9% for the median across this basket of 85 institutional investor peers’ performance. On a three-year basis, LACERA’s private debt returns were 11.7%—in-line with the 11.8% for the top quartile and above the 10% median. And, on a five-year basis, where private debt returns are less dispersed, ICERS returned 9.3%—in-line with the 75th percentile of 9.2% and above the median performance of 7.9%.
As an example of how the shift in the rate regime has more broadly benefited private debt investments, rising interest rates have been a boon to those deploying significant capital in private debt over the past few years, pushing cash yields for middle market senior loans from mid-single digits to low-double digits. Triangulating these relative performances with asset allocation shifts, LACERA’s allocation to private debt increased from 4% at the end of 2021 to 7.7% through 2023. Similarly, ICERS’s allocation to private debt rose from 5% to 7.4% over the same period and VCERA’s allocation rose from 2.7% to 7.2%. OCERS, an underperformer relative to the other three California county plans, were hurt by non-U.S. private debt exposure. OCERS’s U.S. private debt portfolio performed in line against the broader public plan universe with one-year returns of 8.3% and three-year returns of 11.1% as of December 2023.

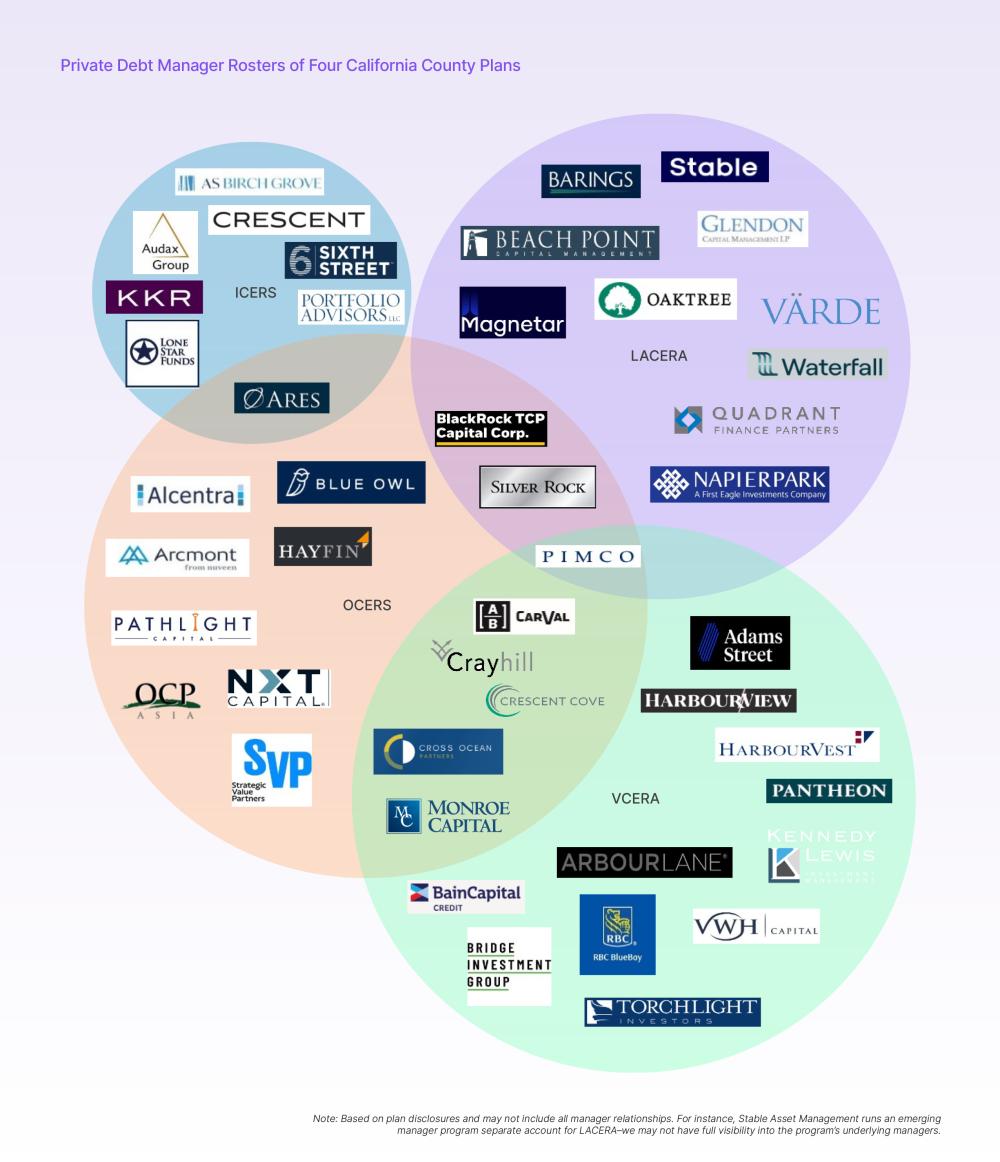
While strategic asset allocation is a major driver of performance for institutional investors, we would be remiss not to examine manager selection as another pivotal piece of the puzzle. The following chart depicts the private debt manager rosters for the four California county plans discussed in the prior sections as of year-end 2023.
Diversity in terms of managers is evident across these four plans’ private debt allocations. No manager is featured across all four plans and PIMCO stands alone as the sole manager appearing in three plans’ rosters. OCERS had the most manager overlap and at least one shared relationship between ICERS, LACERA, and VCERA. Furthermore, OCERS shares Meketa as their general consultant alongside LACERA, with ICERS using Verus and VCERA employing NEPC. LACERA and OCERS also retain Aksia, Albourne, StepStone, and Townsend Group as specialist alternatives consultants, but there were no shared relationships. Notably, ICERS did not have a mutual private debt manager with either LACERA or VCERA.
To specify further, communal investment may be an overstatement depending on the specific strategies in question. Even in the case of PIMCO, we find that the three plans are invested in different offerings including PIMCO’s Corporate Opportunities, DiSCO, Private Income, and Tactical Opportunities funds. However, CarVal Credit Value Fund V, Crayhill Principal Strategies II, Monroe Private Credit Fund III were among the funds identified as having at least two LPs from among these four California county plans.
Looking more closely at individual funds, we find significant dispersion in performance, particularly for distressed/special situations and non-U.S. debt strategies. Among the four plans, private debt investments were heavily clustered around 2018-2022 vintages–perhaps unsurprising given the relatively recent ramp up in allocations to the asset class. From a broader risk perspective, the number of GPs in the private debt space, minimal overlap in GP-LP relationships, at least in this instance, and the nature of private debt ownership vis a vis bonds and syndicated loans all point toward less contagion risk.

This analysis of U.S. public funds reveals diverse strategies employed to navigate the complex and fluid investment landscape while maintaining long-term strategic goals. The top-performing large funds have consistently sought higher returns through increased allocations to private markets—including private equity, private debt, non-core real estate, and infrastructure. Conversely, many smaller U.S. public funds have achieved outperformance primarily through U.S. public equity allocations, more slowly pivoting to private markets than their largest peers.
The case study of the California County plans’ private debt programs further underscores the importance of strategic asset allocation and manager selection. While these investors clearly share belief in the private debt investment thesis, their unique goals, risk tolerances, and market outlooks result in differing outcomes with little overlap in manager and fund selection.
As institutional investors continue to adapt to evolving market dynamics, it is crucial to leverage tools like Nasdaq eVestment Peer Benchmarking and Market Lens to gain insights into asset allocation trends, performance metrics, and manager selection. By arming themselves with transparent peer data, investors can make informed decisions that align with their strategic objectives and enhance their long-term investment performance.
The data in this report is sourced from Nasdaq eVestment Market Lens Wide Angle (MLWA) and our latest solution, Nasdaq eVestment Peer Benchmarking. MLWA is a one-stop-shop for institutional investing intelligence, surfacing over 600,000 manager-consultant-investor relationships as of Q2 2024. Peer Benchmarking is the only asset owner benchmarking solution offering transparent performance and asset allocation data for over 20,000 institutional investors.