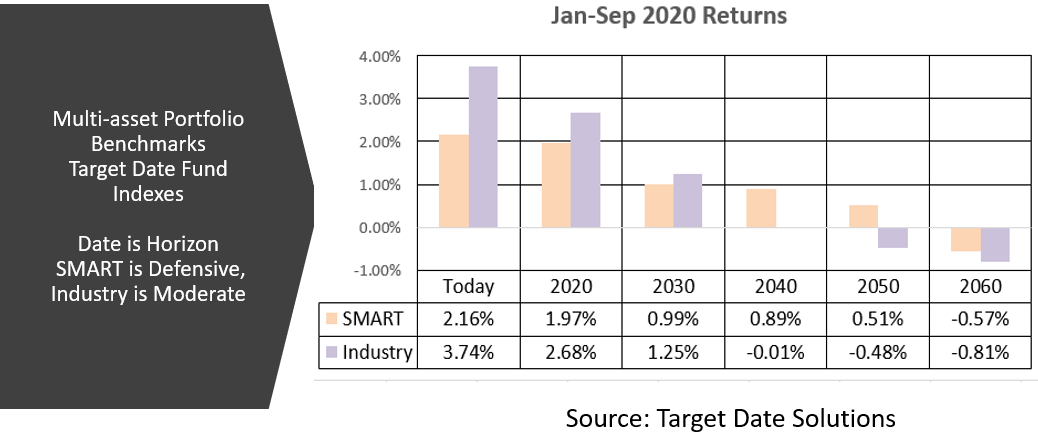
- Depending on your investment horizon and risk preference, your year-to-date performance has ranged between a 1% loss and 4% gain if you held a diversified portfolio.
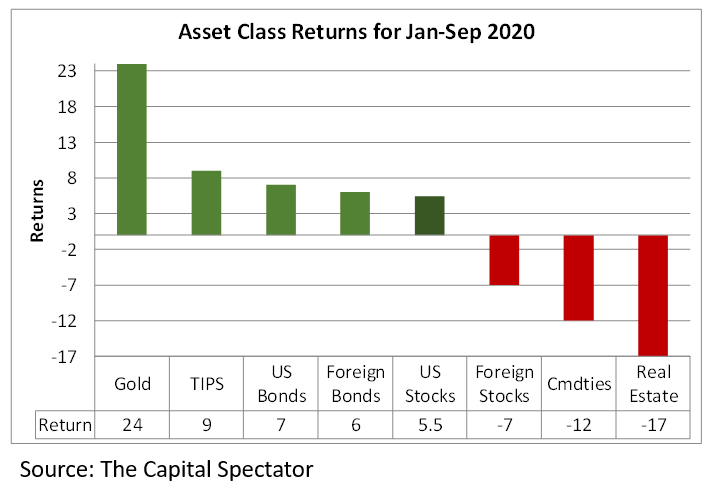
- For perspective, most major asset classes have positive performance so far this year. Asset class returns range from a loss of 17% to a gain of 24%.
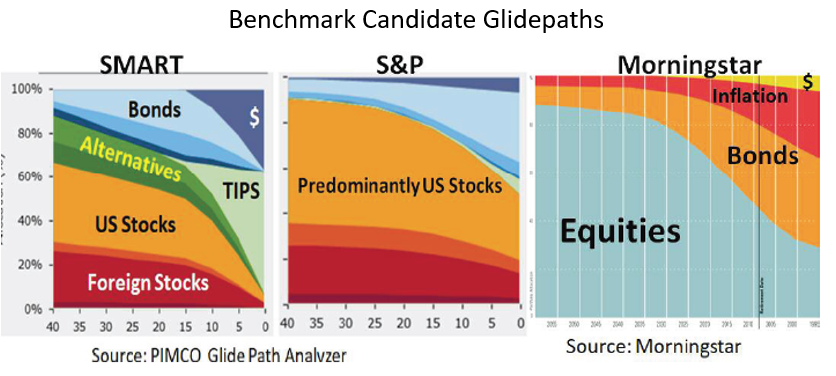
- There is no standard for evaluating global multi-asset portfolios, but we provide a couple benchmark choices.
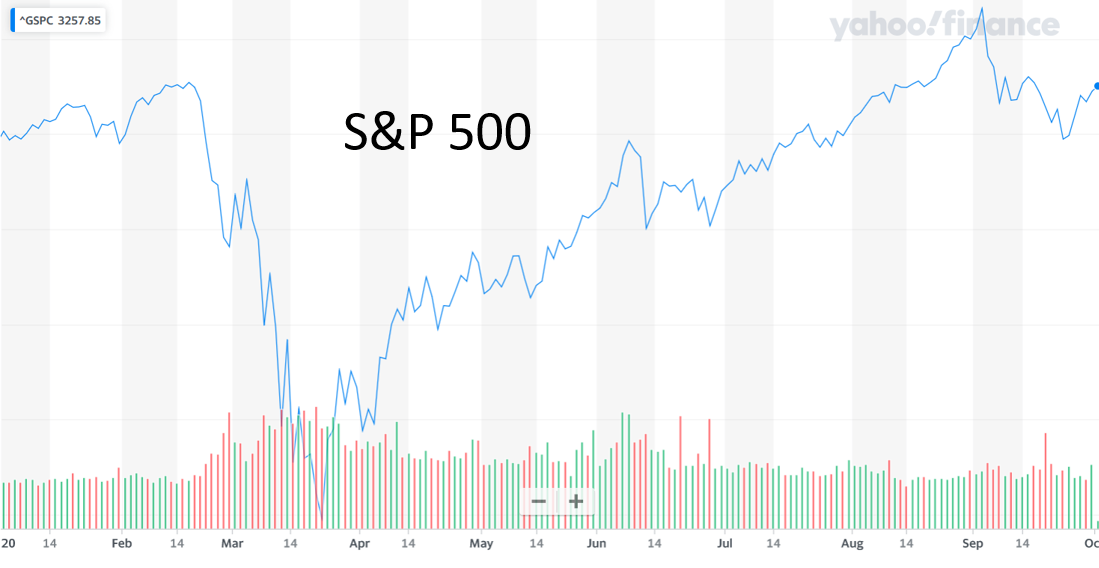
This year of the pandemic has challenged most investors. The US stock market suffered a 35% loss in February-March, but has recovered since then, at least so far.

The question now is whether we’ve had a V-shaped recovery or the first leg of several Ws yet to come. In this report we review the performance through September of various individual asset classes, as well as global multi-asset portfolios.
Asset Class Performance
Led by gold with a 24% return, most assets have delivered positive returns so far in 2020. US stocks have earned 5.5% but foreign stocks have lost 7%. Real estate (REITs) has been the biggest loser with a 17% loss, followed by commodities with a 12% loss. There is a 41% spread between the best and worst performing asset, so asset allocation is, as usual, a powerful determinant of investment performance, as discussed in the next section.

Performance of Global Multi-asset Portfolios
The evaluation of multi-asset portfolio performance needs to hinge upon the purposes of the multi-asset portfolio being evaluated, namely its investment horizon and its risk level. Target date fund performance provides this perspective. There are a few good benchmarks from which to choose described in this article. We use a conservative and a moderate benchmark in the following graph.

The Moderate (Industry) portfolios have performed best at shorter horizons, earning 3.74% for Today funds versus -.81% for a 40-year horizon (2060). Risk has not been rewarded. We use the S&P target date fund indexes for the Industry. Conservative (SMART) portfolios performed better than the industry for long horizons but lag for short horizons. SMART funds are less than 30% in risky assets near the target date, versus more than 80% for the Industry. We view stocks and long-term bonds as risky.

Conclusion
With $2.5 trillion and 30 million investors, target date fund (TDF) performance is a big deal. Good chance you are invested in a TDF. The relevant question is how you have performed relative to what you should have expected. That’s what standards are for – to establish expectations. Without a standard, we are judging blindly. One of the potential standards shown above might make your TDF performance look good while the other does not. Choose your standard wisely.
Ron Surz is CEO of Target Date Solutions, Age Sage, GlidePath Wealth Management, and co-host of the Baby Boomer Investing Show that you can binge watch on Patreon.
The views and opinions expressed herein are the views and opinions of the author and do not necessarily reflect those of Nasdaq, Inc.
