Why Ticks Matter
Because we want Nasdaq listed stocks to trade as efficiently as possible, we’ve spent a lot of time researching how to make that happen—from looking at how odd-lots are missing from NBBO to how tick-constrained stocks increase spread costs for investors.
It turns out stocks can have prices that are either too low (which adds to fragmentation and costs) or too high (which adds to odd lots, NBBO problems and costs).
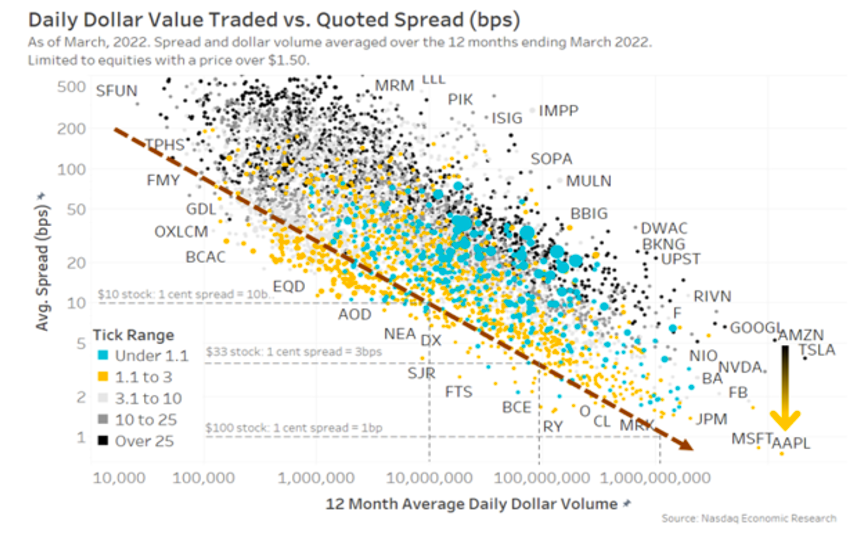
You can see this in Chart 1 below, which looks at large-cap stocks:
- Tick-constrained stocks: The blue dots all trade with a 1-cent spread all the time. However, that’s usually because their 1-cent spreads are more expensive than they need to be, resulting in longer queues (large circle size).
- High-priced stocks: As stocks get higher-priced (move to the right on the chart), they are more likely to turn into darker grey dots, meaning their spread represents more ticks. They also lift off the horizontal axis, showing an increased probability of odd lots inside the NBBO, as round lots get too large for many traders. As a consequence, the “depth” (large dots for black stocks) isn’t actually at the best price.
Chart 1: Looking at tradability by stock price

All of this research into tradability has culminated in our paper that identified the perfect stock price. The data from Chart 1 is expanded to all stocks in Chart 2 and plotted with liquidity (in $) on the horizontal axis. What we see is that:
- For all stocks with the same liquidity (any vertical slice), the spreads were tightest for stocks with a 1- to 2-tick spread (yellow dots are the lowest).
- Spreads are naturally wider for less liquid stocks (diagonal brown arrow), even though some of them have high enough prices to have tighter ticks (black dots).
Chart 2: More liquid stocks trade with tighter spreads, regardless of the stock price

We have then used this knowledge to show that stock splits save dollars for investors, which is why they make sense for issuers.
But if we can’t get stocks to split, is there another way to save investors trading costs and complexity?
Does our one-size-tick fit all?
The suboptimal pricing that we see above is not the company’s fault. It’s because the U.S. market has a 1-cent tick and 100-share round lots for all stocks, regardless of price.
Which raises an interesting question: Does our one-size-tick fit all?
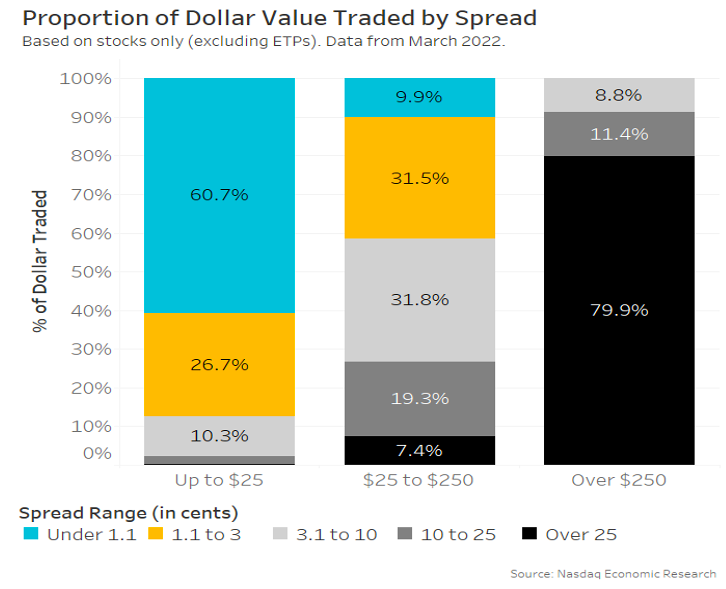
The answer is clearly no. Just grouping stocks by stock price to demonstrate how tradability changes as stock price changes show:
- Below $25, the tick costs from 4 to 100 basis points.
- Almost all tick constrained stocks are priced below $25 (blue in the left column below)
- Although over a quarter of stocks under $25 are also “perfectly” priced (yellow).
- Almost 5% of the sub-$25 stocks also trade more than 25-ticks wide.
- Over a quarter of stocks between $25-250 trade with spreads more than 25-ticks wide.
- Over $250, the level chosen in NMS-II to split round lots to 10-shares, the tick falls below 0.4 basis points, much less than almost any stock naturally trades now (Chart 2).
- Consequently, almost all stocks (89%) over $250 trade with spreads more than 25-ticks wide (black in the right column below), with none being near their perfect stock price.
Chart 3: How many stocks are “perfectly priced?”

We can also look at this data from the investor’s perspective – looking at how much it affects notional trading. Doing that, we see:
- Over 60% of all value traded in sub-$25 stocks is tick constrained.
- Only 2% of value traded in that group is in stocks with more than 10 tick spreads, even though those stocks account for 20% of the companies in that price group – a sign that these much wider spreads are in thinly traded stocks.
- Still, none in stocks over $250 are “perfectly priced.”
Chart 4: A higher proportion of trading value is done in perfectly priced stocks

What is the problem with multi-tick stocks?
The biggest problem for an investor with multi-tick stocks is posting at the NBBO, only to see someone bid 1-cent better and gain queue priority without improving the spread by an economically significant amount. This increases the time and decreases the probability of a fill for the original order, making it more likely that they will end up paying the spread, which we know costs investors more. Over time, based on order type usage in these high-priced stocks, investors seem to avoid signaling to the market and instead use hidden orders that don’t improve the public NBBO.
Or, worse, you post at a new NBB, only to find out there are odd lots at better prices.
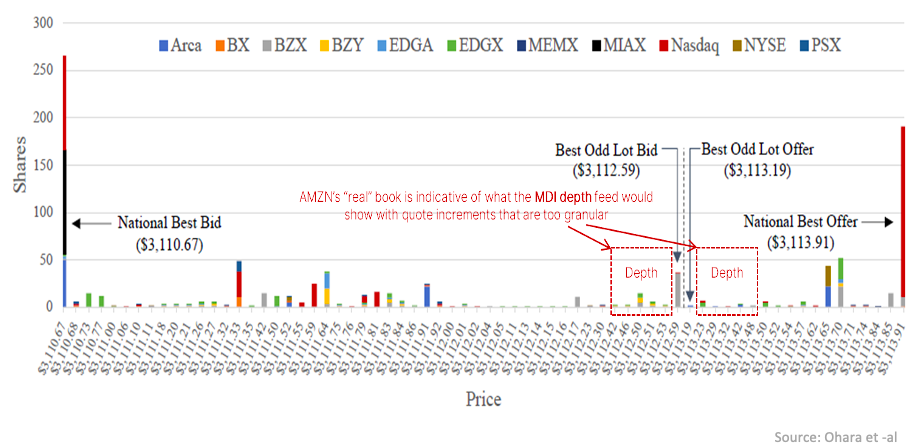
For example, see a snapshot of the AMZN from a recent study below. The spread is AMZN averages around 9 basis points, which is also around 270 ticks. That means the cost to “penny” an earlier order is just 1 tick, or 0.03 basis points (or 0.0003%). To put that in perspective, the cost to improve the spread in Microsoft, an equally liquid stock that is closer to perfectly priced, is around 0.3 basis points, or 10 times higher.
As a result, AMZN has a multitude of odd lots at different prices inside the NBBO. In fact, in this example, the midpoint (which is used for some hidden orders) is outside of the true best prices in the market (the odd-BBO).
Chart 5: AMZN has around 270 different ticks inside the NBBO where odd lots can rest

All these granular price levels might also make the SEC’s new “depth in the SIP” feeds much less useful.
How do other countries do ticks?
We are not the first country to notice this problem and wonder how to fix it.
In fact, many countries have, for years, realized that a one-tick-size does not fit all, as it can distort trading economics in ways that make it harder for investors to get and keep queue priority and avoid signaling.
Europe has a dynamic tick regime that accounts for all that we have discussed above. Ticks change as stock prices change so that the economic cost (in basis points) is consistent. In addition, knowing that natural spreads increase as liquidity decreases, Europe has different tick regimes for stocks with more (or less) liquidity.
Europe has also analyzed its data on the impact of this nearly optimal tick regime and found that it also reduces quote flickering and message traffic. Based on their results, ESMA considered that the optimal tick sets spreads between 1.5 and 2 ticks for liquid securities and between 1.5 and 5 ticks for less liquid securities. That is consistent with other research using U.S. stocks (as well as our own findings in Chart 2 above).
But not all countries make tick rules as complicated as Europe.
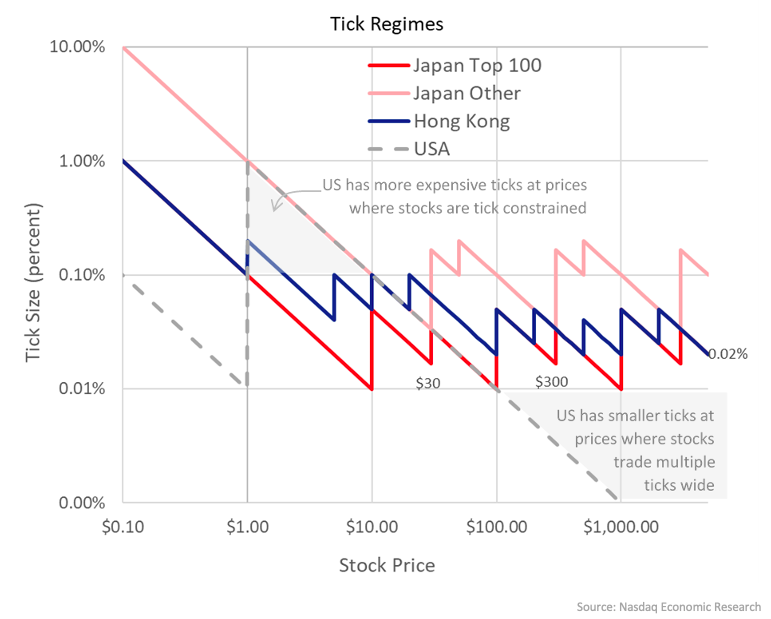
Hong Kong has a single tick regime that applies to all stocks equally (Chart 6, blue line). By splitting the cent, it allows ticks to fall 0.1% below a $10 price. Then it sets ticks higher than 1-cent for higher-priced stocks. They have also adopted at least 2 tick changes for every 10x change in price, which for liquid stocks is consistent with ESMA’s recommendation of setting a maximum 5-tick spread. The result is a minimum tick that ranges between 2 and 10 basis points. In addition, lower-priced stocks in Hong Kong have a higher minimum tick of 4 basis points, which may reflect a pattern we see in the U.S. of less liquid stocks usually having lower prices.
In contrast, Japan has tackled the liquidity and spread problem in a slightly different way, with a lower tick for more liquid “Top 100” stocks (red line) and a separate wider tick for other stocks (pink line).
Plotting tick size in percentage costs shows how the U.S. regime compares (grey dashes). We have much higher tick costs below $10, where many stocks are tick constrained, while the opposite happens above $100, where the U.S. has market trades many of these stocks with spreads closer to 0.05% wide regardless of the smaller tick.
Chart 6: Comparing tick regimes in the U.S., Japan and Hong Kong; those with dynamic ticks have consistent tick costs

Why does this matter?
Trading is important. An appropriate lot size and tick size can help reduce trading costs and make it simpler for investors to trade without signaling or risking giving away queue positions.
How the rest of the world has tried to solve this problem is to make the tick different, so the “economics” of spreads are the same.
The views and opinions expressed herein are the views and opinions of the author and do not necessarily reflect those of Nasdaq, Inc.
