Who Is Really Creating Market Quality in Nasdaq Nordic-listed Stocks?
Tight spreads and deep, actionable liquidity are important for investors as it reduces their costs to trade. Academic research also finds that it is important for issuers with lower volatility and smaller spread costs reducing their cost of capital.
The prices that exchanges publish create large and positive benefits (what economists call “externalities”) for investors and the public while also contributing to efficient asset allocation. Consequently, it is important for regulators and investors to ask: “How do individual venues contribute to the security’s price formation process?”
But in fragmented markets like the U.S. and Europe, with prices available to all at the speed of light, working out where prices are really being set, where actionable liquidity is best, and whether one market is doing more for market quality than others is hard.
However, there are ways to show that market quality isn’t equal across all venues – by measuring the quality of individual venues across multiple dimensions of their order books.
In today’s study, we examine two dimensions of the Nasdaq Nordic markets: price formation and implicit trading costs. We find that Nasdaq’s Nordic Exchanges set prices far more often and have more depth than other markets in Europe trading Nasdaq Nordic-listed stocks.
Price formation
Price formation, or price discovery, refers to the process through which new information is incorporated into prices.
In modern equity markets, this takes place through the continuous interactions between buyers and sellers. In a fragmented setting — where the same security trades across multiple order books —a single metric, such as the time each venue spends at Europe-wide best prices (the European Best Bid and Offer or EBBO), can make markets look misleadingly equal.
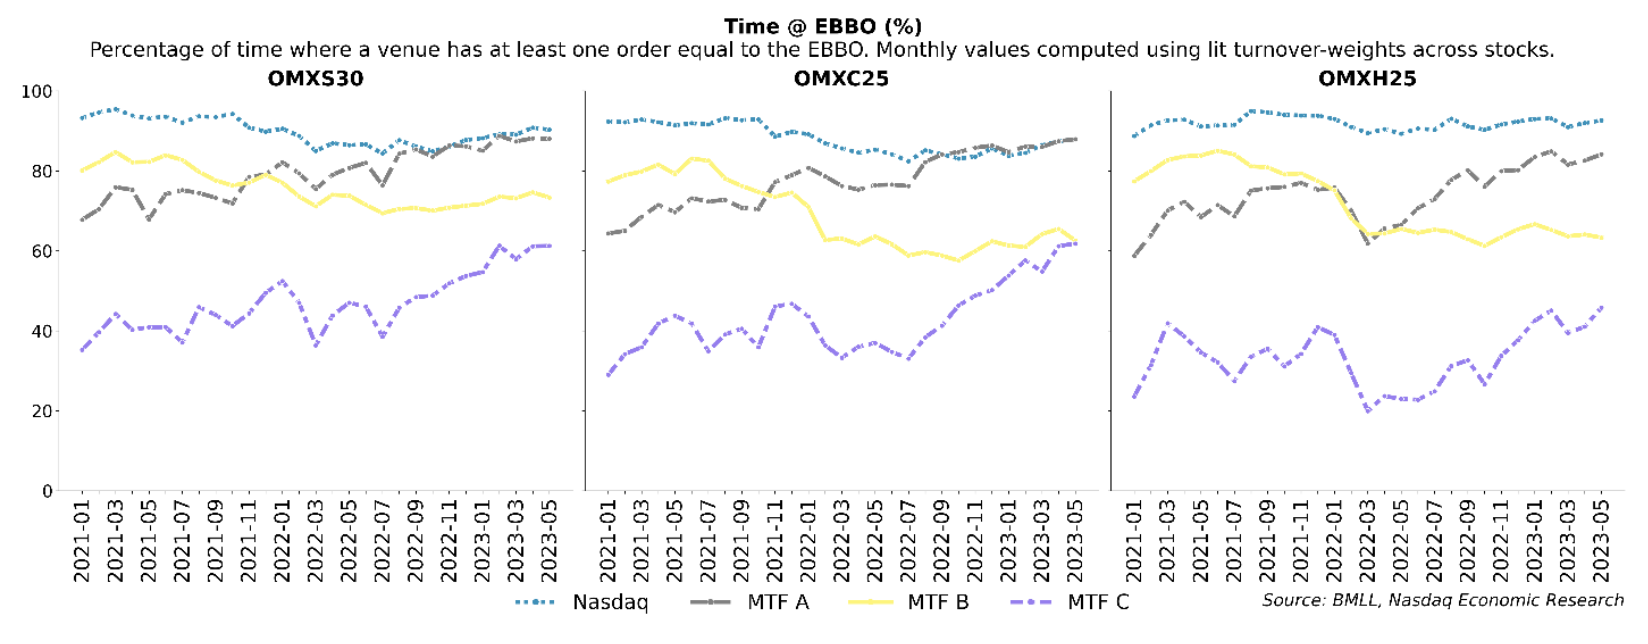
Chart 1: Time at EBBO

If we instead look at the EBBO setting frequency for the constituents of the OMXS30, OMXC25, and OMXH25 indices over the last two years across Nasdaq (the primary listing venue) and the three largest multilateral trading facilities (MTFs), we see much more differentiation.
- Chart 1 shows that throughout 2023, Nasdaq and MTF A have had a comparable time at the EBBO.
- In contrast, more than 50% of all EBBO improvements originate on Nasdaq. This number is approximately 2x to 3x larger than the next largest venue.
Chart 2: EBBO setting frequency

The difference between these two metrics potentially highlights the extent of price matching behavior (matching a new price set elsewhere) and/or stale pricing (one or more venues sitting at an older price while true prices have moved on) on the different venues.
Both are costly for investors, especially if they regularly route to prices that are no longer current.
Costs of liquidity
The second aspect influencing investors’ trading outcomes is the cost of liquidity on the different venues. We can compare the cost of the bid-ask spread as well as the depth available at the best prices – across different venues – to assess the costs of liquidity.
A smaller bid-ask spread and a higher depth are indicative of better (lower cost) liquidity.
Comparing these two metrics across the four main venues for Nordic stocks (constituents of the OMXS30, OMXC25, and OMXH25 indices) over the last two years, we see that Nasdaq order books have the lowest liquidity costs — tightest spreads and highest depth — across all main venues.
Chart 3: Quoted spreads

For instance, in 2023, the bid-ask spread on the largest MTF was, on average, 8%, 20%, and 8% larger than that on Nasdaq for OMXS30, OMXC25, and OMXH25 stocks, respectively (Chart 3).
Similarly, the depth on the largest MTF was around 40%, 47%, and 56% smaller than that on Nasdaq for the same indices (Chart 4). These lower liquidity costs are a direct consequence of the diversity of flow (retail, institutional, and prop) on Nasdaq’s order books.
Chart 4: Quoted top-of-book depth

What does this mean for investors?
The data shows Europe’s markets aren’t as equal as an EBBO might infer.
Nasdaq’s Nordic markets set prices far more and have lower spread costs along with deeper liquidity. That translates to improved execution outcomes for retail and institutional investors – including the ability to trade large sizes at the best Europe-wide prices with low market impact.
This is also important for regulators, who may see all quotes as equal. In fact, that’s how the U.S. SIP is constructed now – and rather than incentivizing better market quality, aspects of the current “equal” revenue allocation model create distortions and cross-subsidies that add to fragmentation and search costs.
Fragmented markets are already complicated. It’s important that market rules don’t add to distortions and make the best prices and liquidity even harder to source.
The views and opinions expressed herein are the views and opinions of the author and do not necessarily reflect those of Nasdaq, Inc.

