Portfolio rebalancing is the practice of realigning a portfolio’s actual allocations with the allocation percentages that were originally intended by the advisor and their client. The problem: rebalancing can negatively impact performance in pursuit of risk controls, and it’s unclear which is the optimal rebalancing frequency.
Which strategy is best for managing risk and maximizing performance? Can you save time, money, and effort without sacrificing either? And do bull or bear markets make a difference?
To help advisors and planners rebalance portfolios in a way that is beneficial to both clients and their practice, this white paper examines how six different rebalancing strategies affect portfolio performance and risk over 25 years of history, including four bull markets and three bear markets. The findings show the pros and cons of different rebalancing schemes and can inform your own best practices. Plus, the experiment was conducted entirely within YCharts using the powerful Model Portfolios tool—create your own here.
The white paper includes free-to-download visuals that can be easily shared with your clients and colleagues. Each finding and visual is data-driven and unbiased, but they are not meant to serve as investment advice.
Here’s a preview of what’s inside:
Visualizing the Benefits of Rebalancing
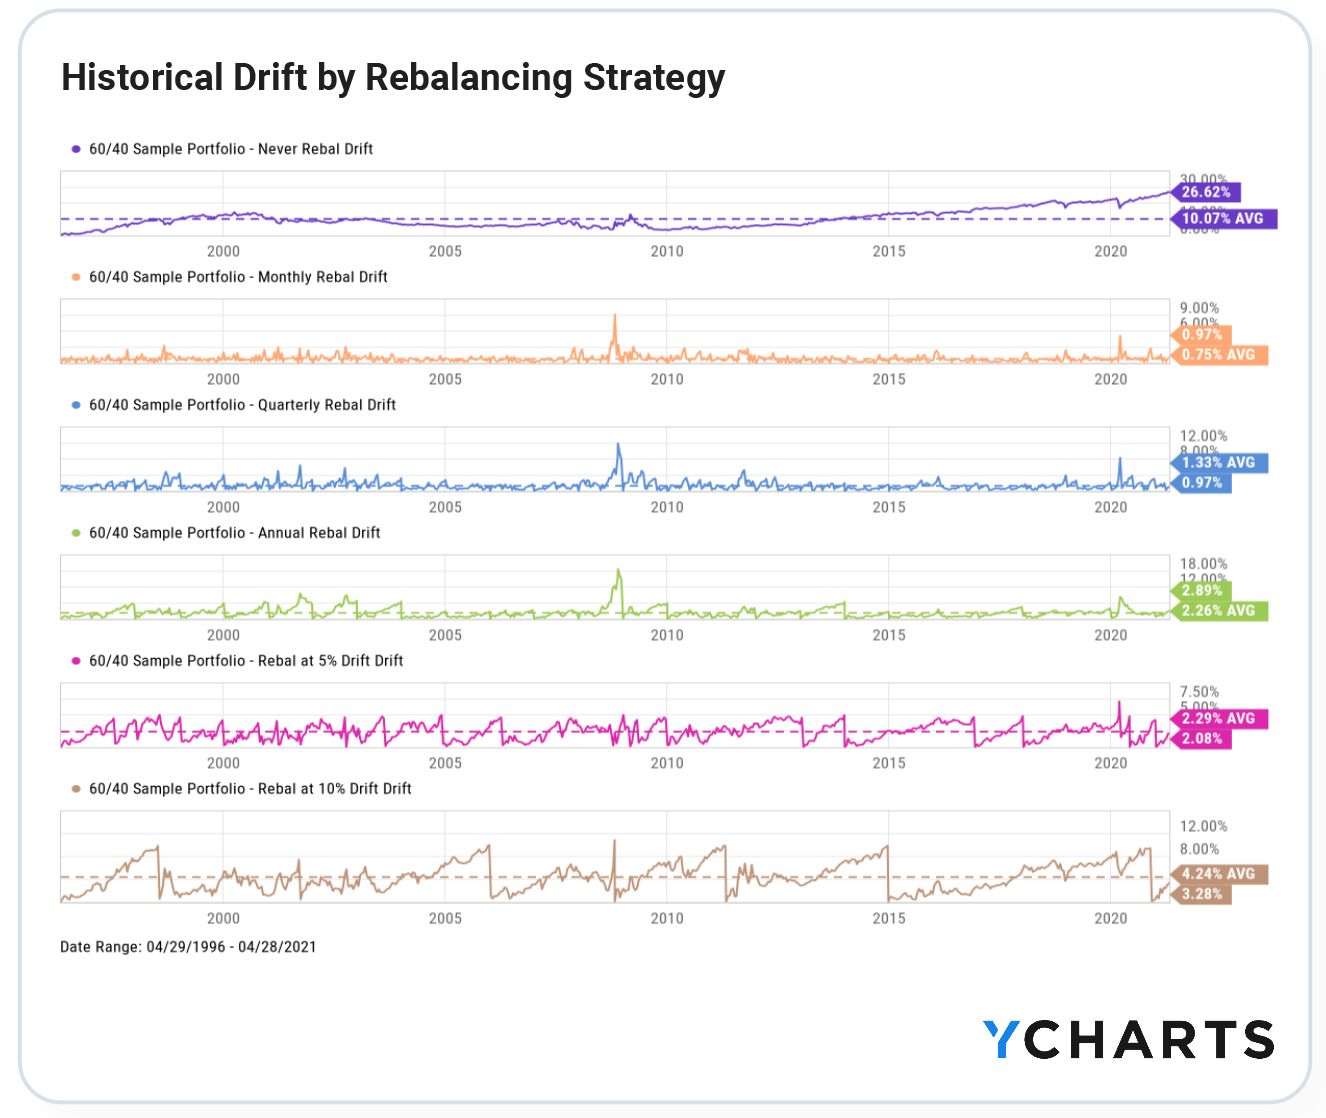
The six rebalancing strategies examined include Monthly, Quarterly, and Annual Rebalancing, 5% Drift and 10% Drift Triggered Rebalancing, and a Never Rebalanced portfolio. Each portfolio holds the same five Vanguard mutual funds and, at their varying frequencies, are rebalanced to identical allocations that sum to a 60% equity and 40% fixed income strategy.
Shown in the chart, portfolio drift for each of the six strategies generally increases over time, then reverts to 0% at each instance of rebalancing. As the frequency and count of rebalancing increases, the 25-year average drift for a portfolio decreases.

Download Visual | Access the White Paper
This visual effectively demonstrates to clients how their actual allocations may trend relative to exposures they agreed upon with their advisor, but are always restored to intended levels.
How Rebalancing Affects Portfolio Performance
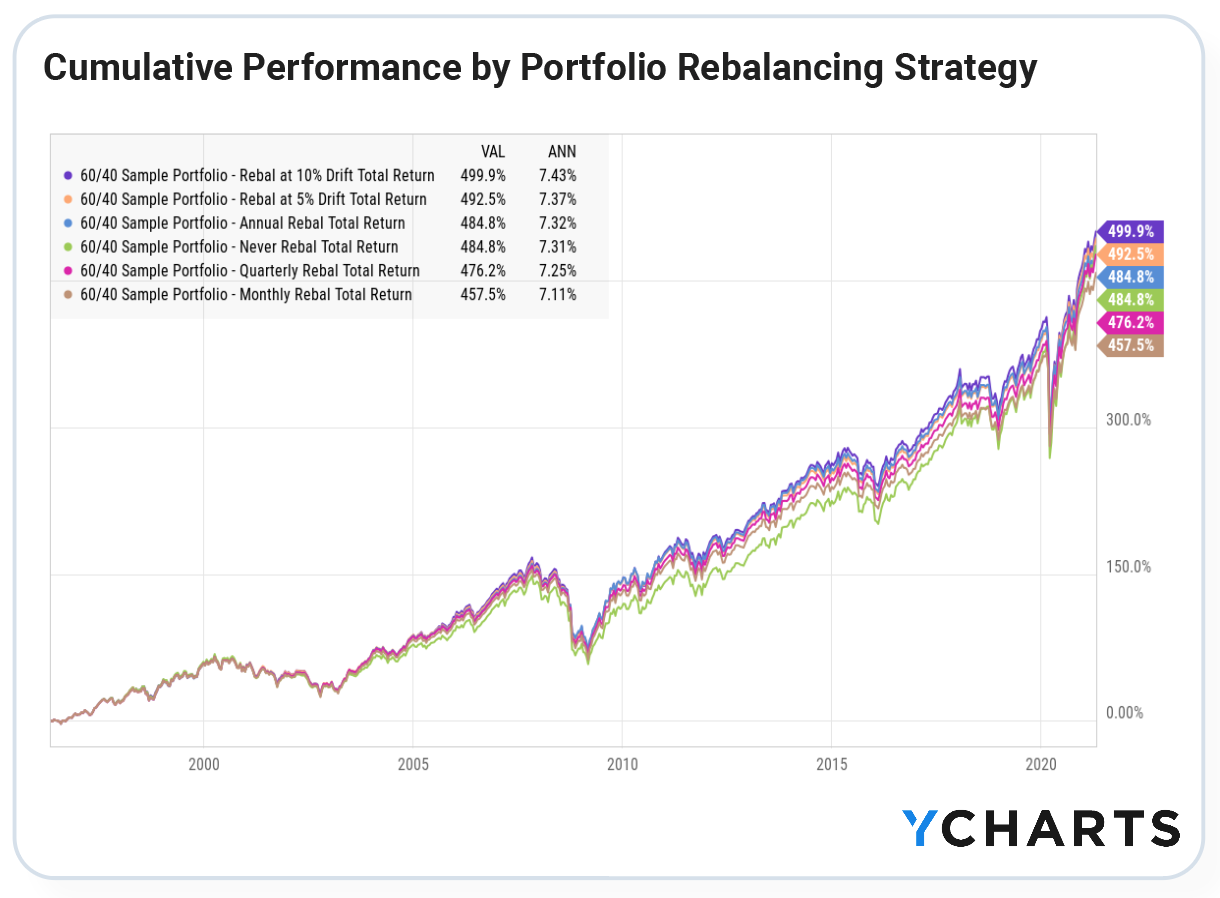
The experiment determined that, over the long term, rebalancing a portfolio based on drift triggers—as opposed to calendar-based strategies like annual and quarterly rebalancing—leads to better cumulative performance.
Interestingly, strategies that rebalanced more frequently, especially monthly rebalancing, yielded the lowest cumulative performance over time.

Download Visual | Access the White Paper
A noteworthy caveat: though this experiment included 25 years of history, that period includes a record-breaking bull market for stocks, favoring the 60/40 equity-fixed income allocation used.
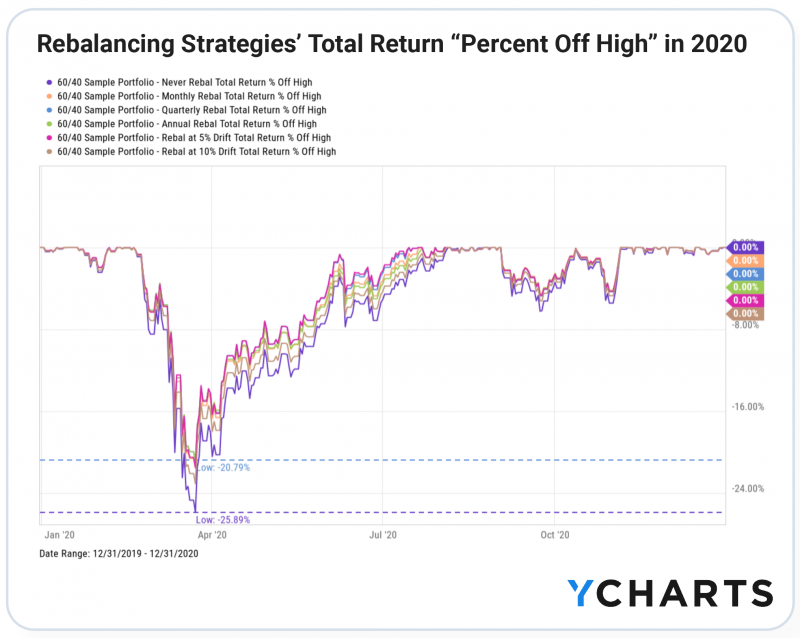
Still, rebalancing can and does protect portfolios from downside risk, illustrated in the “percent off high” chart for all six portfolios. The quarterly rebalanced portfolio fell 20.8% from its recent high while a portfolio that was never rebalanced fell 25.9%—a potential difference-maker for both clients and their stomachs.

Download Visual | Access the White Paper
The market sell-off in early 2020, prompted by COVID-19, was one of a few bear market periods the white paper examined. Amid a strong bull recovery, all six portfolios went on to set new highs as early as July of the same year. Juxtaposed with the different drawdowns on the chart’s left side, it becomes apparent that rebalancing affects portfolios differently in bull and bear markets.
Rebalancing in Practice
Moving beyond the theory of optimal rebalancing strategies, the actual practice of rebalancing a portfolio requires the advisor’s time, incurs transaction costs, and may also trigger capital gains (i.e. taxes) or losses. These expenses and opportunity costs have to be weighed against the benefits offered by different rebalancing strategies.
The optimal rebalancing strategy for managing risk, maximizing performance, and minimizing costs incurred by advisors will change over time, based in part on market conditions. However, more important than any of these factors is the client’s comfort level with the chosen rebalancing strategy.
As is often said, peace of mind can be priceless.
Connect With YCharts
To get in touch, contact YCharts via email at hello@ycharts.com or by phone at (866) 965-7552
Interested in adding YCharts to your technology stack? Sign up for a 7-Day Free Trial.
Disclaimer
©2021 YCharts, Inc. All Rights Reserved. YCharts, Inc. (“YCharts”) is not registered with the U.S. Securities and Exchange Commission (or with the securities regulatory authority or body of any state or any other jurisdiction) as an investment adviser, broker-dealer or in any other capacity, and does not purport to provide investment advice or make investment recommendations. This report has been generated through application of the analytical tools and data provided through ycharts.com and is intended solely to assist you or your investment or other adviser(s) in conducting investment research. You should not construe this report as an offer to buy or sell, as a solicitation of an offer to buy or sell, or as a recommendation to buy, sell, hold or trade, any security or other financial instrument. For further information regarding your use of this report, please go to: ycharts.com/about/disclosure
The views and opinions expressed herein are the views and opinions of the author and do not necessarily reflect those of Nasdaq, Inc.
