When Performance Matters: Nasdaq-100 vs. S&P 500 Second Quarter '19
Editor’s Note: An updated version of this story can be found here: When Performance Matters: Nasdaq-100 vs. S&P 500 Second Quarter ’20.
The Nasdaq-100 and S&P 500 are two of the most popular equity indexes in the US. The Nasdaq-100 is heavily allocated towards top performing industries such as Technology, Consumer Services, and Health Care, which have helped the Nasdaq-100 outperform the S&P 500 by a wide margin between December 31, 2007 and June 28, 2019. Below is a comparison of annual total returns - which reinvest dividends - between each index. The Nasdaq-100 TR Index has outperformed nine out of the 10 years in our study.


Historic Performance
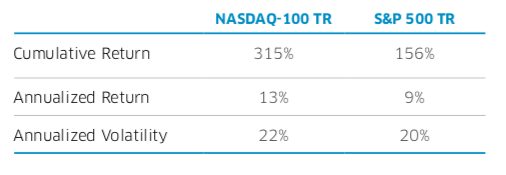
The table below and the charts above display historical performance figures for both the Nasdaq-100 TR and the S&P 500 TR between December 31, 2007 and June 28, 2019. The Nasdaq-100 TR Index displayed more than double the cumulative total return, on just slightly higher volatility.

Rolling Volatility (One Year)
One year rolling volatility (calculated by taking the standard deviation of daily returns, annualized) was 93% correlated between Dec 31, 2007 and June 28, 2019, when comparing the two indexes. Given the large exposure the Nasdaq-100 has towards Technology, the ability for the Nasdaq-100 to closely track the volatility of the S&P 500 is rather impressive.

Current Industry Weights
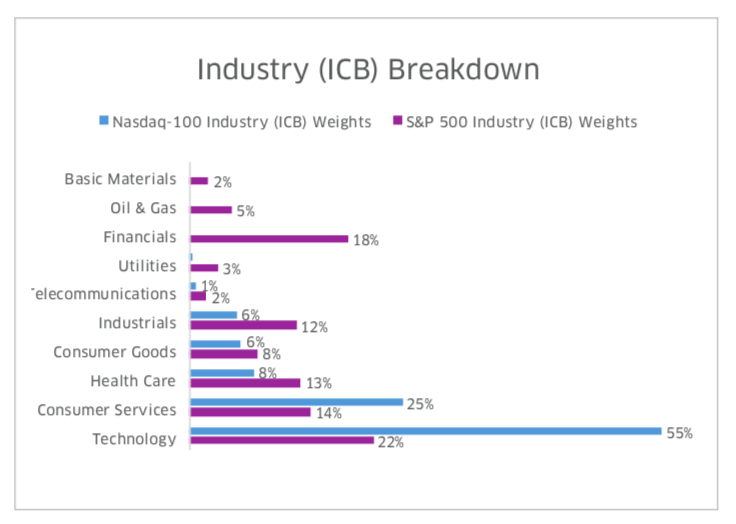
We can see important differences between the Nasdaq-100 and the S&P 500 as of June 28, 2019. As mentioned previously, the largest allocations in the Nasdaq-100 are geared towards Technology (55%), Consumer Services (25%), and Health Care (8%). The large allocations to both Technology and Consumer Services have helped propel the Nasdaq-100 Index to a new all-time high as of the close on May 3, 2019.
Despite the sharp drop in the market from October to December 2018, the Nasdaq-100 still outperformed S&P 500 by 4% in 2018 and by 3% in the first half of 2019 from a total return standpoint.

Conclusion
The Nasdaq-100 and S&P 500 are two of the most popular volatility analysis over the last 11 and a half years. The Nasdaq-100 is heavily allocated towards top performing industries such as Technology, Consumer Services, and Health Care. The growth of companies in these industries has continued to be strong. Given the way technology is influencing the world and making companies more efficient, this trend is more than likely to continue going forward.
Market participants looking to gain exposure to the Nasdaq-100 Index can do so through a number of products tracking the index. Learn more here.
Nasdaq® is a registered trademark of Nasdaq, Inc. The information contained above is provided for informational and educational purposes only, and nothing contained herein should be construed as investment advice, either on behalf of a particular security or an overall investment strategy. Neither Nasdaq, Inc. nor any of its affiliates makes any recommendation to buy or sell any security or any representation about the financial condition of any company. Statements regarding Nasdaq-listed companies or Nasdaq proprietary indexes are not guarantees of future performance. Actual results may differ materially from those expressed or implied. Past performance is not indicative of future results. Investors should undertake their own due diligence and carefully evaluate companies before investing. ADVICE FROM A SECURITIES PROFESSIONAL IS STRONGLY ADVISED.
Contact Us
Nasdaq 100 Index
