News & Insights


The Nasdaq-100® and S&P 500 stand as two of the most prominent equity indices in the United States. With a significant focus on innovation across sectors like Technology, Consumer Discretionary, and Health Care, the Nasdaq-100 has managed to outshine the S&P 500 by a considerable margin over the last 16 years (12/31/2007 – 12/31/2023).
Let's delve into a detailed analysis of their annual total returns, factoring in reinvested dividends. Notably, the Nasdaq-100 Total Return™ Index has outperformed the S&P 500 in 12 out of the 16 calendar years in our study, resulting in an impressive average return of +18.7%. The year 2023 was particularly remarkable for the Nasdaq-100, which saw a 55% increase, significantly outperforming the S&P 500 by 29%. This margin of outperformance was the largest observed since 2020 when the Nasdaq-100 led by more than 30%
The Nasdaq-100 Index's outperformance over the S&P 500 in 2023 was significantly driven by its substantial exposure to Technology and Growth-oriented stocks, particularly those involved in Artificial Intelligence (AI). AI-centric companies within the Nasdaq-100 saw remarkable growth due to advancements in technology, increased adoption of AI solutions across various industries, and heightened investor enthusiasm for AI's transformative potential.

Credit: 2023 data is through 12/29/2023
Historical Performance
Amidst recent market volatility, the Nasdaq-100 Total Return Index has consistently sustained cumulative total returns exceeding twice the performance of the S&P 500 Total Return Index.

Credit: 2023 data is through 12/29/2023
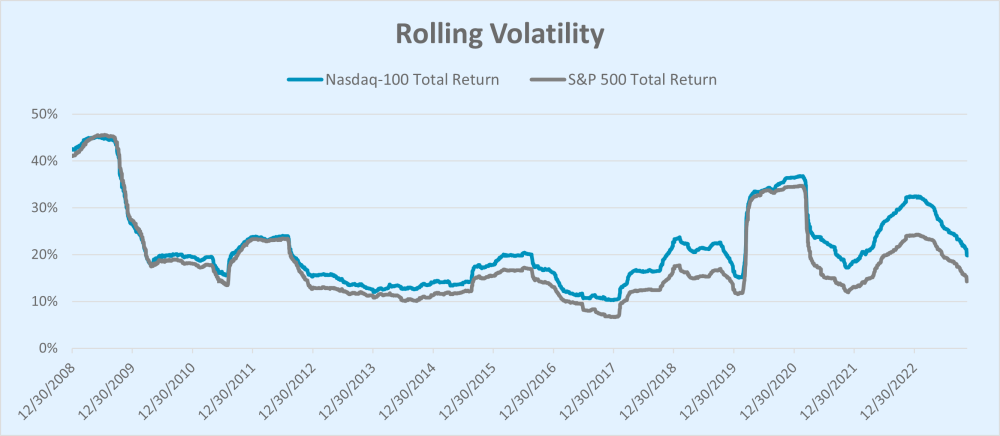
Rolling Volatility
The one-year rolling volatility, calculated by annualizing the standard deviation of daily returns, has shown a slight elevation in the Nasdaq-100 compared to the S&P 500. On average, it has been just 2% higher over the 16-year period spanning from December 31, 2007, to December 31, 2023. What's particularly noteworthy is the impressive overall correlation of daily returns, which is 93%. This level of correlation is impressive, especially considering the Nasdaq-100's heavy concentration in the Technology sector.
Current Industry Weights
As of December 31, 2023, there are notable disparities in sector allocations between the Nasdaq-100 and the S&P 500. As highlighted earlier, the significant weightings in the Technology and Consumer Discretionary sectors have played a pivotal role in driving the Nasdaq-100 to multiple years of outperformance over the past 16 years. By design, the Nasdaq-100 does not have any Financials exposure.

Conclusion
By the close of 2023, the Nasdaq-100 surged by 55% on a total return basis, markedly surpassing the S&P 500's 26% increase. This impressive performance is attributed to the index's strategic focus on high-growth sectors such as Technology, Consumer Discretionary, and Health Care. Despite facing economic challenges like inflation, supply chain disruptions, and shifts in central bank policies, companies within the Nasdaq-100 demonstrated remarkable resilience, contributing to the index's robust gains. The advent of AI technology, driving efficiency and fostering innovation across various industries, has further reinforced the index's capacity for sustained outperformance. The innovative core of the Nasdaq-100 positions the index well to manage future uncertainties and sustain growth.
Sources: Nasdaq Indexes, Bloomberg
Disclaimer: Nasdaq® is a registered trademark of Nasdaq, Inc. The information contained above is provided for informational and educational purposes only, and nothing contained herein should be construed as investment advice, either on behalf of a particular security or an overall investment strategy. Neither Nasdaq, Inc. nor any of its affiliates makes any recommendation to buy or sell any security or any representation about the financial condition of any company. Statements regarding Nasdaq-listed companies or Nasdaq proprietary indexes are not guarantees of future performance. Actual results may differ materially from those expressed or implied. Past performance is not indicative of future results. Investors should undertake their own due diligence and carefully evaluate companies before investing. ADVICE FROM A SECURITIES PROFESSIONAL IS STRONGLY ADVISED
The views and opinions expressed herein are the views and opinions of the author and do not necessarily reflect those of Nasdaq, Inc.