
What to Watch for in 2023
Last year turned out to be a difficult year for bond and stock investors. According to Deutsche Bank, 2022 was the first time in over 150 years that both the 10-year Treasury and S&P 500 fell more than 10%. In fact, the 10-year Treasury lost 17% and the S&P 500 was down 18%.
As we recently showed, market returns were mostly driven by interest rates rising, which were in turn driven by inflation, which proved far more stubborn than expected.
Helped by the fact that 10-year Treasuries rates started from the second lowest yield in 237 years, at just 1.5%, the Fed pushed short-term rates up 425 basis points (bps) last year, the most aggressive tightening cycle since the 1980s. In response, long-term (10-year) interest rates rose by 235 bps to end the year at 3.9%.
In 2023, with inflation starting to ease, the focus will turn to when and at what rate the Fed ends its rate hike cycle and whether it will cause a recession in the process.
Persistent strength of spending and employment data – despite current interest rates – supports the Fed’s recent views that rates need to tick slightly higher before they pause.
But other data suggests a slowdown is already underway. That increases the risk of a steeper recession and a fall in earnings. Markets seem to agree this is more likely and are pricing in the Fed reducing interest rates before year-end.
2022 returns were driven by rates, which were driven by inflation
Looking at the performance of key ETFs, we see that not all bonds and stocks were impacted equally (Chart 1):
-
Growth stocks and long-term Treasuries, which are more interest rate sensitive, fared the worst.
-
Value stocks fell much less, thanks (typically) to relatively stronger cashflows and dividends.
-
Shorter-term debt also benefited from being able to reinvest maturing debt in new higher-yielding bonds as rates rise.
Commodities (grey bars) were among the few bright spots in 2022. Real commodities were already seeing strong demand from Covid spending. Then shortages caused by the war in Ukraine added to further price spikes. Consequently, energy companies and some high-yield debt tied to oil and gas extraction also performed well.
Chart 1: 2022 returns for key ETFs

Inflation finally fading
Recall that up until late 2021, the Fed was convinced that inflation was “transitory,” caused mostly by Covid, which had created supply chain shortages, and strong demand (via stimulus and savings).
But as vaccinations became more widespread early in 2022, that was expected to affect the economy much less, helping inflation to fall as consumers returned to normal activities.
Instead of that happening, the war in Ukraine in February caused additional shortages of energy and food, pushing prices even higher – especially in Europe. Vaccines also caused a shift in spending from goods to services, leading to a shift in labor demand. Complicated by early retirements, staffing shortages added to wage growth and inflation.
The CPI finally peaked back in June, but at 9.1% p.a. (Chart 2, orange line).
However, it has been falling consistently for the past five months and now sits at 7.1% p.a.
Chart 2: Most components of inflation are now slowing
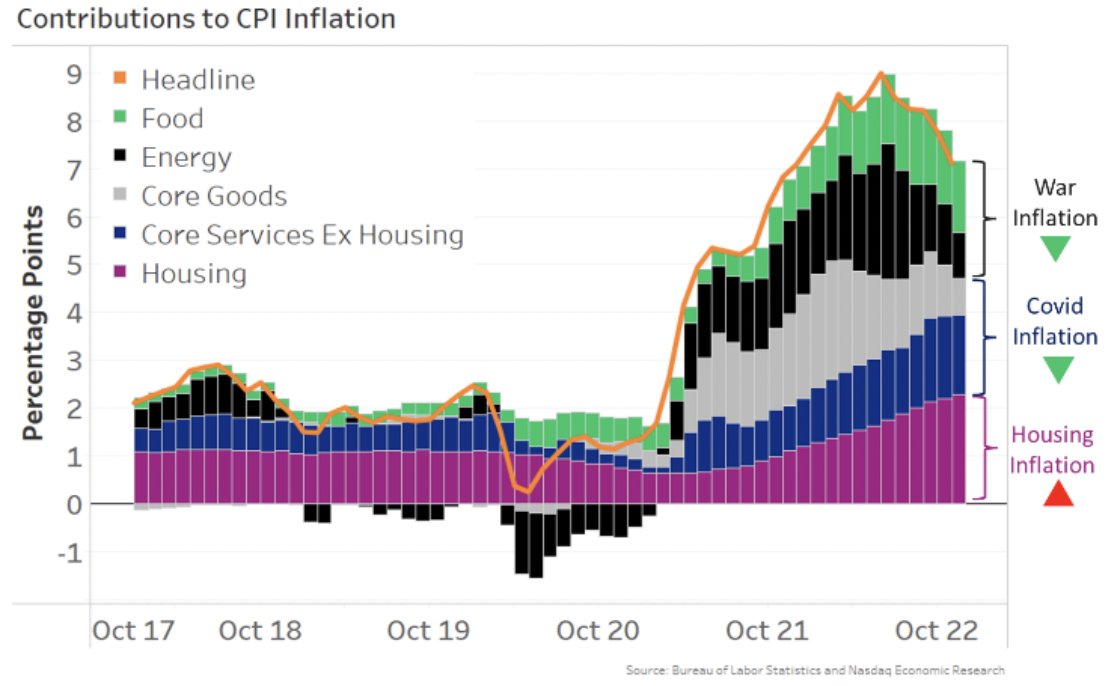
Most economists expect inflation to keep falling into 2023.
As the economy slows (Chart 5), we’ve seen energy prices fall significantly from their highs.
Housing inflation (purple bars above), which is now the biggest driver of inflation, is expected to slow soon, with prices on newly-sold homes and newly-signed leases declining lately.
Supply chains are also mostly back to normal, and there are signs the labor shortage has eased. That has, in turn, reduced pressures on the costs of production.
Falling inflation means rates should peak soon too
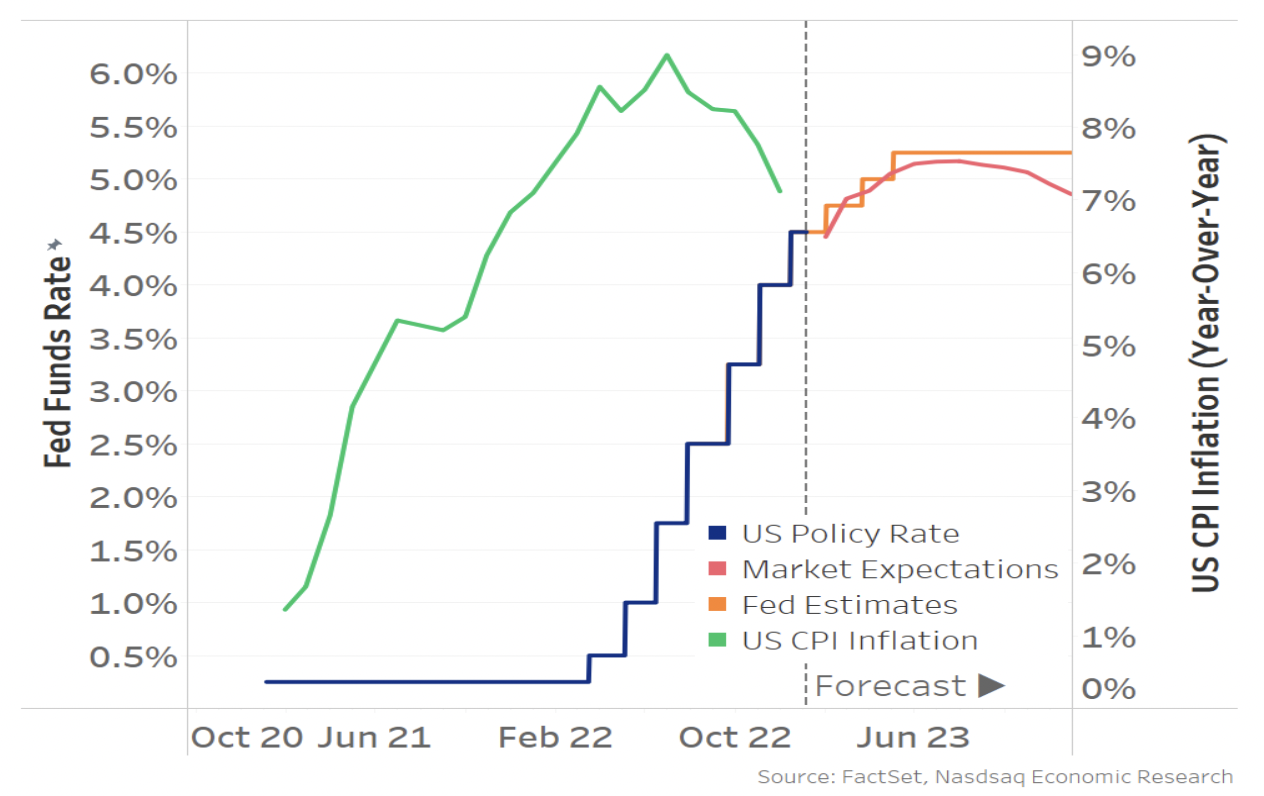
With inflation trending lower, this is expected to be the year when many central banks stop raising interest rates. In fact, the Fed’s own projections show rates peaking at 5.25% (and staying there).
However, markets are pricing in a lower peak in rates, of 5.15% by midyear, followed by 30bps in cuts by year-end (red line).
Chart 3: With the inflation peak behind us, the Fed and markets disagree on the path for rates
Why does the market disagree with the Fed?
Fed Chair Powell has made it clear that he wants even more evidence that inflation is on a path back to 2% before he cuts rates.
However, the market is concerned that this will result in interest rates rising too high. That could lead to a worse economic slowdown where employment and consumer spending both fall. That, in turn, would require the Fed to reverse course, cutting rates before year-end just to stop the economy from falling into a worse recession.
Looking at the data, it’s hard to tell right now who is right.
NBER says: We are not in a recession now
One factor in the Fed’s favor is that, looking at many metrics, the economy currently looks far from recession.
Although we did see back-to-back declines in quarterly GDP in the first half of 2022, that’s not how the NBER defines a recession.
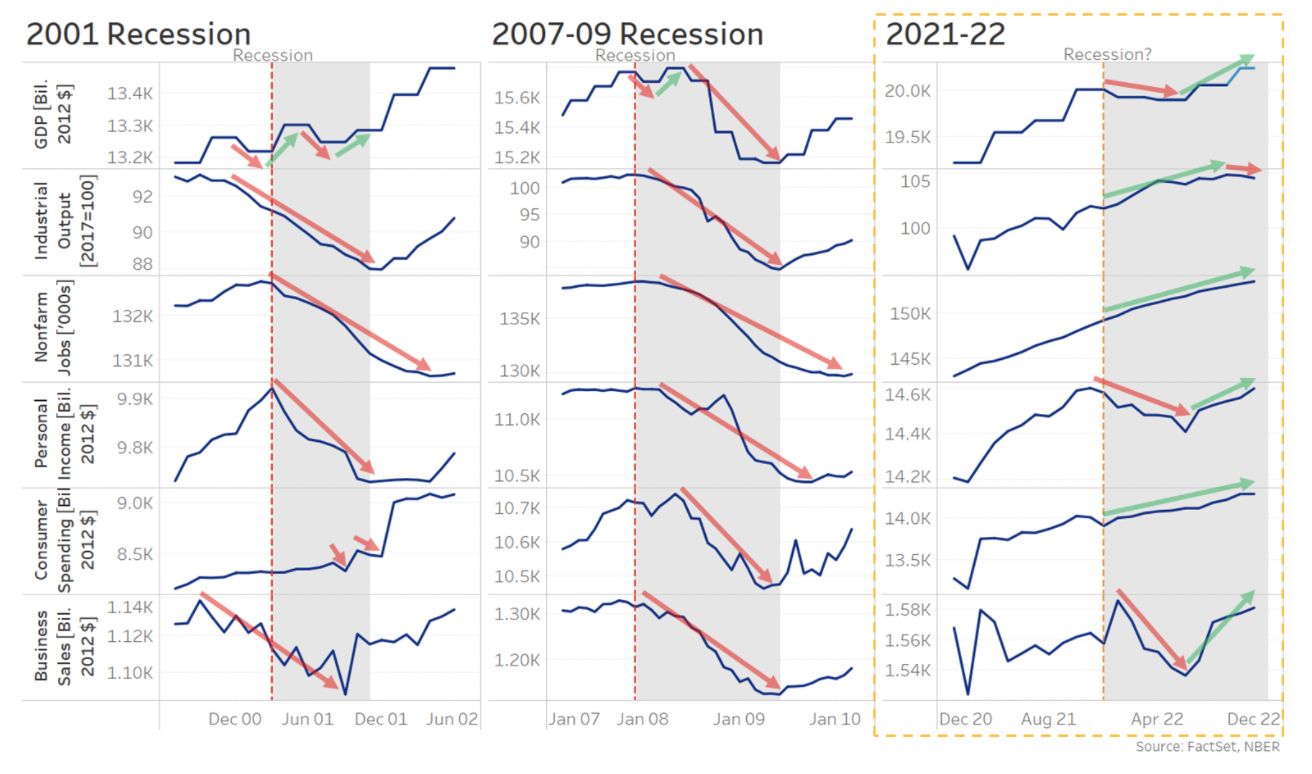
Instead, the NBER looks at multiple measures of output, employment, income and sales. Data shows that most of those metrics are currently improving (Chart 4, third column), especially compared to the recessions in 2001 and 2008.
In addition, the Fed’s two main twin objectives (unemployment and inflation) are also near multi-decade records, with unemployment at 3.7% and inflation (with the core PCE, the Fed’s preferred measure) at 4.7% p.a.
Chart 4: By the data that determine recession, there was no recession in 2022
But forward-looking data shows a weaker 2023 ahead
However, a lot of forward-looking data point to a slowdown ahead.
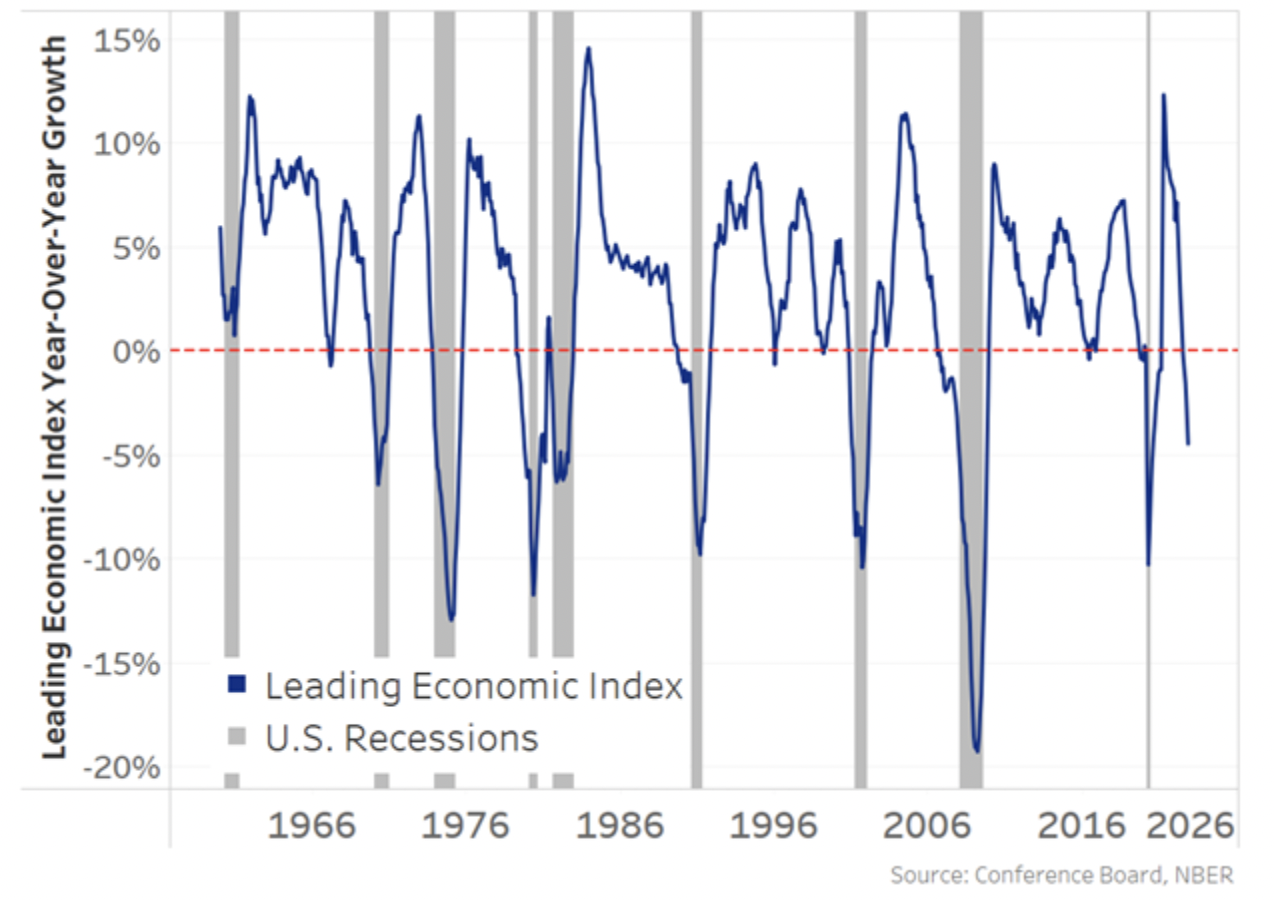
For example, the Conference Board’s U.S. Leading Economic Index (LEI) year-over-year growth rate is already down to levels seen in or just ahead of each of the last eight U.S. recessions (Chart 5, blue line) – and far worse than the levels reached in the 1960-61 recession (leftmost shaded area).
The LEI shows a variety of leading indicators for the entire economy – like stock prices (reflecting market expectations), consumer expectations (indicating likely spending plans), building permits (future housing activity), and new unemployment claims (flows into unemployment) – as a single number.
Chart 5: Conference Board’s LEI at readings seen around past recessions
State-level data indicates the slowdown is broad-based too. For instance, in October, over half of all states (27) saw negative growth in their Philly Fed composite indices. Research shows the economy typically falls into recession when 26 or more states see negative growth, going back to 1980.
U.S. and global PMIs, which are based on surveys of companies, also show the manufacturing sector is in contraction, with new orders especially weak (blue lines in Chart 6), pointing to challenges maintaining earnings in 2023.
Chart 6: Falling new orders are a sign of weaker consumer demand to come
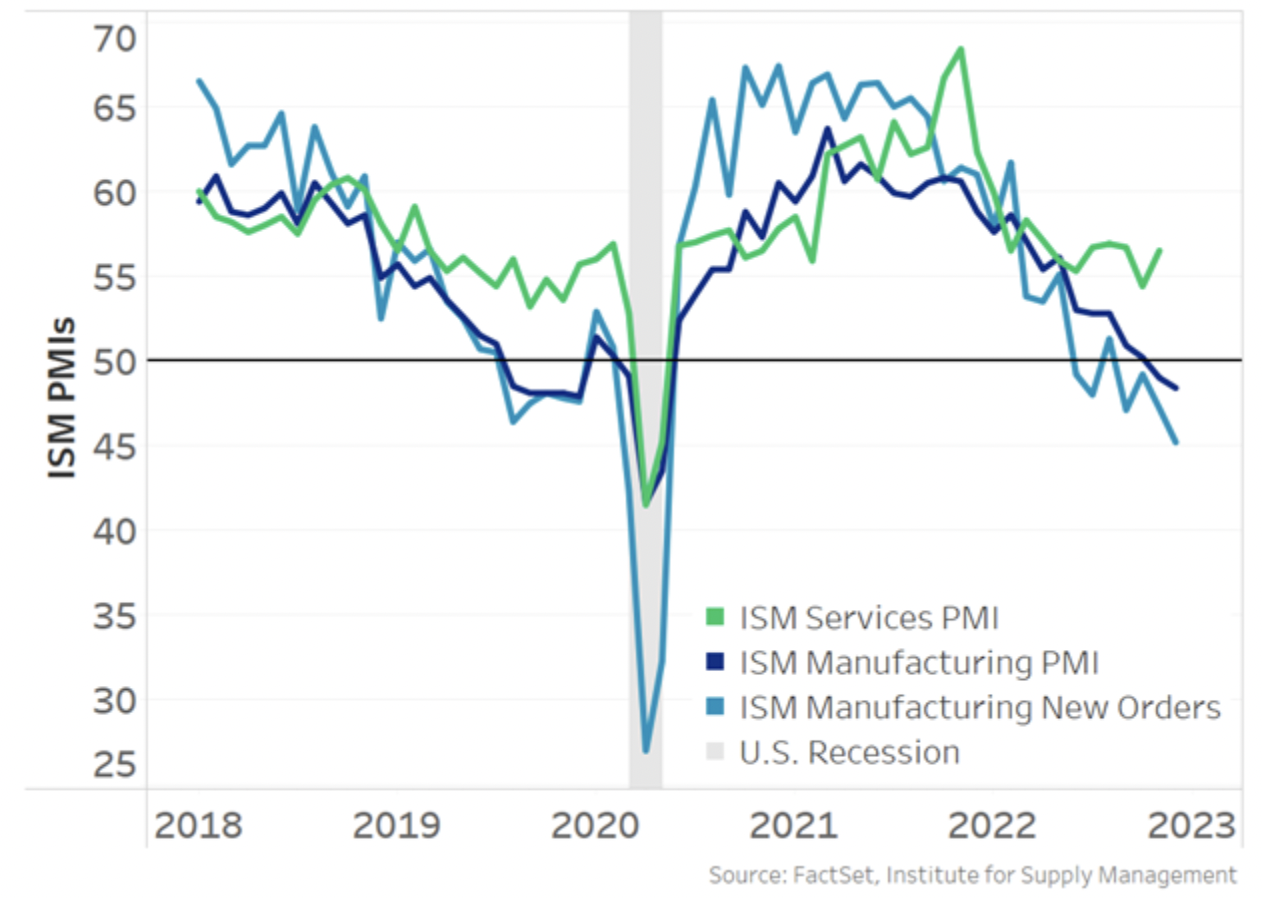
Interestingly, the services PMI (green line) still remains in expansion, even though it has fallen from its highs over the past 12 months. Importantly, the service sector accounts for three-quarters of the U.S. GDP, so its resiliency is part of the reason many think even if the broader economy slows, services can help us avoid a steeper recession.
Stocks are pricing in a soft landing
Looking at the stock market, we see that in 2022, stock prices mostly adjusted to the changes in the 10-year rates (grey triangle in Chart 7). In fact, valuations based on trailing PEs (the orange dots) remain just below the historic trendline that accounts for different long-term interest rates (horizontal axis).
Said another way: With earnings growth mostly stalling, the fall in stock prices mostly accounts for the increase in 10-year Treasury yields, up from 1.5% to 3.8% now.
That’s in contrast to the change in PEs in 2021 (orange arrow), where earnings growth was strong, bringing the trailing PE back into a fair value range by the end of the year – a sign that markets accurately expected back in December 2020 that earnings growth would be strong in 2021.
Chart 7: We’re not going back to 0% rates anytime soon, so expect lower PEs
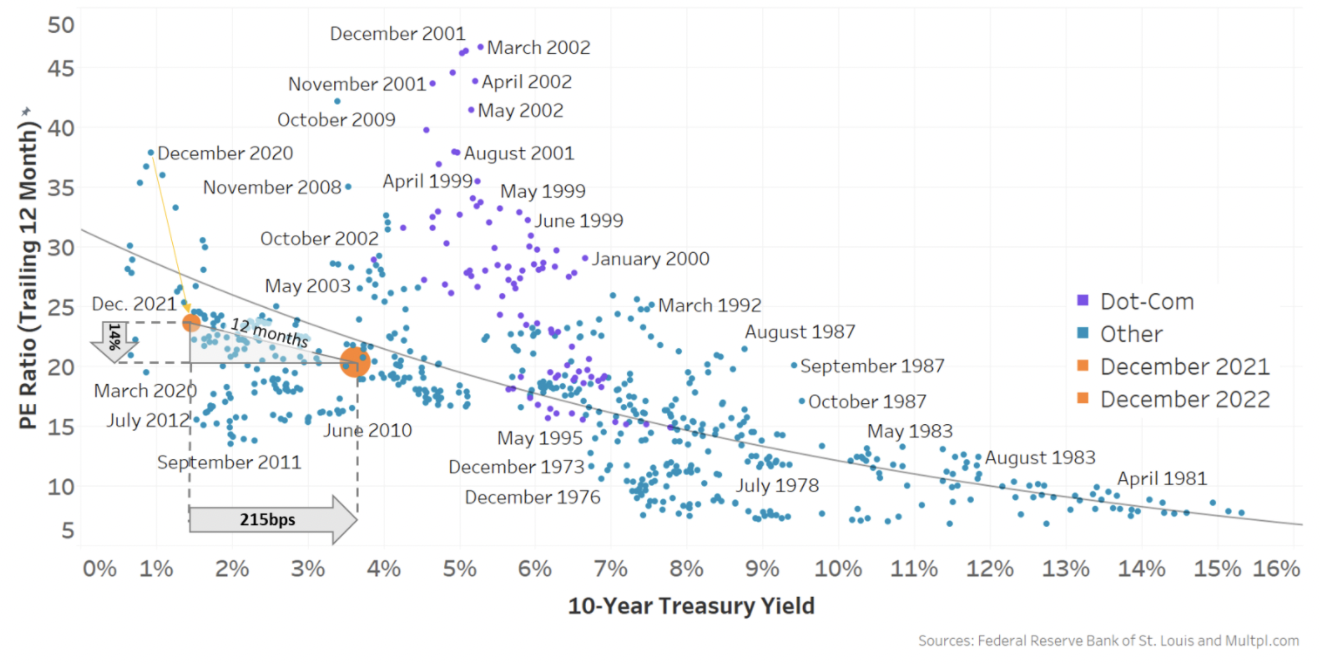
This chart also explains why earnings and future interest rates will be important to stock returns.
-
Higher rates act as a headwind for valuations – prices should fall if earnings don’t change.
-
Increased earnings make PEs (valuations) fall and make stocks look more attractive.
Current stock prices (large orange dot) show the market is currently pricing in a year where rates and earnings don’t change much.
As it turns out, that’s in line with estimates for rates and earnings.
Inflation could stay elevated, which means rates should too
Although the market expects rates to start to fall in 2023 (Chart 3), rates are not expected to fall much and certainly not back to zero (Chart 3, red line).
One reason for rates to remain around current levels is that inflation is expected to remain well above the Fed’s 2% target for a while. That is partly due to additional costs of manufacturers re-shoring their supply chains. A recent survey found 62% of manufacturers have started this shift, which reduces supply chain risks but adds costs.
The strength of the underlying economy, especially the data in Chart 4, also suggests a more moderate slowdown with continued demand is also possible.
Both suggest we are unlikely to see the Fed cut rates to 0% as it did in 2008 and 2020, even if we enter a small recession.
Earnings are forecast to be flat (again) in 2023
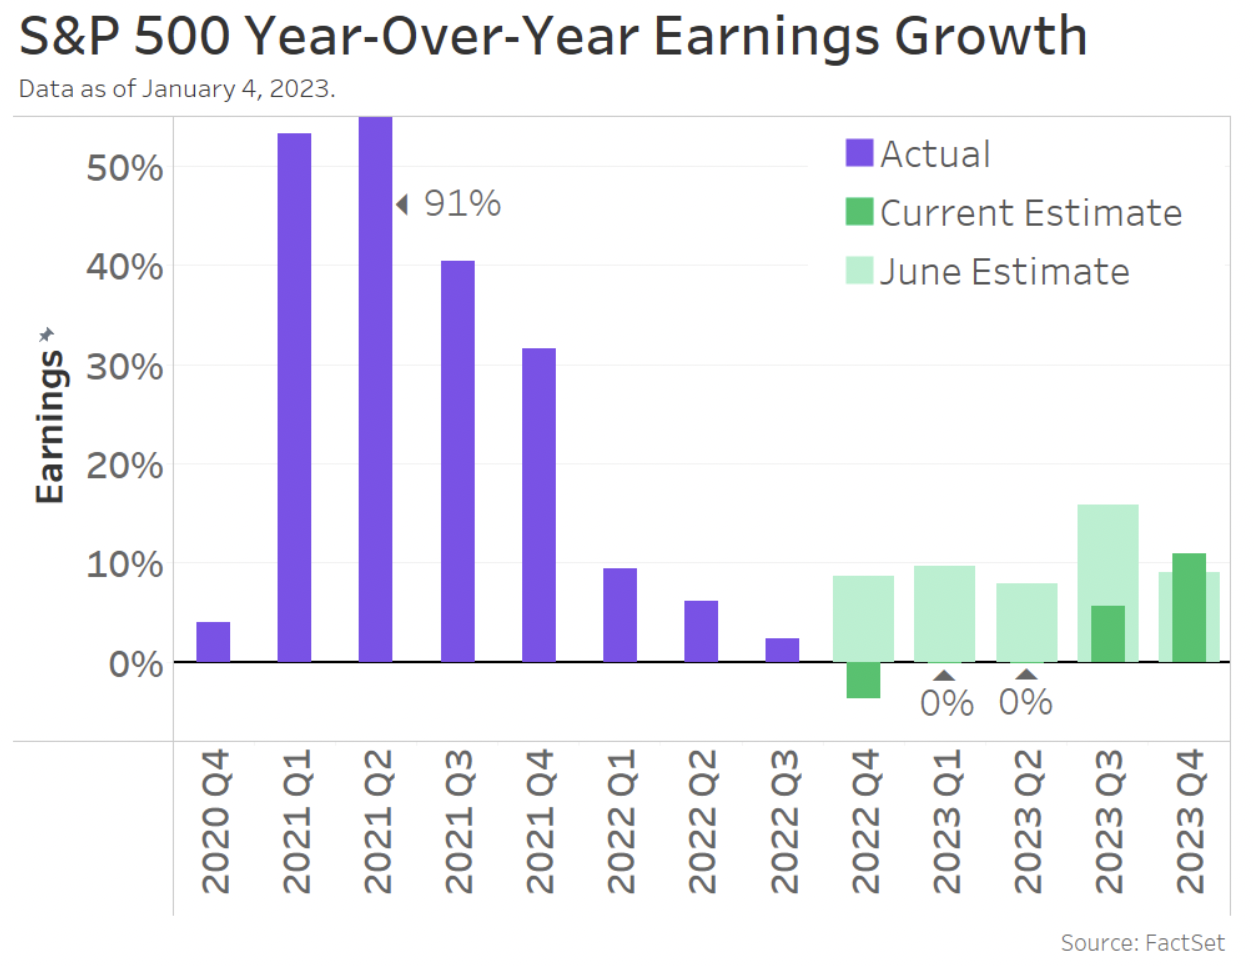
Current analysts’ earnings estimates also show close to zero earnings growth (dark green bars in Chart 8), meaning 2023 earnings will be close to in line with last year.
Chart 8: Analysts have already revised down earnings a lot
Companies are more cautious
In contrast, and more reflective of the weak forward orders in Chart 6, CEO confidence indexes have fallen to levels consistent with recession. The latest reading is the lowest since the depths of the Global Financial Crisis (Chart 9, black line), with 98% of respondents saying they’re preparing for a recession, though most expect it to be “short and shallow.”
Typically, when CEO confidence is this weak, it’s also a bad sign for earnings. Over the more than 40 years in Chart 9, when the confidence index is near current levels, earnings (purple line) have fallen by at least 9%.
Chart 9: CEOs are preparing for a recession, which could mean negative earnings growth

In reality, even analysts’ earnings forecasts are ticking down too. Looking back to Chart 8, the light green bars show 2023 earnings were expected to grow by 10% p.a. as recently as six months ago.
It all depends on whether the Fed gets a soft landing or a recession
This gets us back to whether higher interest rates and the Fed cause a recession (or not).
With just a mild slowdown, current expectations for rates to stay roughly where they are and earnings to slow, too, seem plausible. Even CEOs don’t expect a deep recession.
Chart 10: Unemployment is very low but can rise quickly (during a recession)

However, when an economy slows down, feedback loops can quickly turn slowdowns into recessions. The data in Chart 10 shows that when unemployment starts to rise, it often rises quickly and significantly. Rapid unemployment could then cause a drop in consumer confidence, reducing spending, leading to discounting and lower company earnings, resulting in even more layoffs.
However, with 1.7x more job openings than unemployed workers right now and estimates showing a labor shortage of 3.5 million people – it is possible that moderate layoffs need not add to total unemployment.
Many experts are hedging their bets
Although a majority of experts have been predicting a recession for a while, the underlying economy has remained robust, helped by consumer savings and strong employment – despite high interest rates.
That has led many to hedge their bets for 2023, offering both “soft landing” and “recession” forecasts in parallel. According to Bloomberg, year-end S&P 500 targets vary significantly:
-
The S&P is currently around 3900
-
The median prediction has the S&P 500 ending the year at 4078 – a gain of 6%
-
Projections range from a loss of 11% to a gain of 24%
-
With a potential worst-case scenario for the S&P 500 as low as 3000
Either way, with rates likely to stay higher (or earnings falling), new all-time highs seem unlikely this year.
We’re also hedging our bets
Just like many others, we’re hedging out bets, and waiting for more data, too!
The unemployment rate will be particularly important. Right now, the Fed expects the unemployment rate (Chart 10) to rise from 3.7% now to 4.6% next year. But historically, an increase of just 0.5 percentage points in the unemployment rate is almost always associated with recession and unemployment increasing 2 percentage points or more.
If we’re lucky, inflation will keep falling while employment and earnings both hold up.
But let’s end on a positive note! The past two recessions were the two worst in post-war history, so we should remember that even a more normal recession will feel like a mild slowdown to many.
Michael Normyle, U.S. Economist at Nasdaq, contributed to this article.
Other Topics
US Markets Central Banks Earnings
Phil Mackintosh
Nasdaq
Phil Mackintosh is Chief Economist and a Senior Vice President at Nasdaq. His team is responsible for a variety of projects and initiatives in the U.S. and Europe to improve market structure, encourage capital formation and enhance trading efficiency.
Read Phil's Bio