
What to (and Not to) Fear When the Fed Tightens
Executive Summary
This paper intends to provide a “reality check” of the stock market performance towards the Fed tightening risk by exploring the last 30 years of equity market history and focusing on the evidence derived from solid quantitative measures and proven financial records. Investors may have responded quite negatively to the Fed tightening this year. However, the opposite has tended to hold true over the long term: equity markets have largely benefited from the rising 10-year U.S. Treasury yields over the past 30 years. Additionally, U.S. large-cap/growth stocks, such as the Nasdaq-100® (NDX™), have outperformed during the yield pickup periods. The outperformance of NDX was the joint effect of having the highest EPS growth and a more favorable valuation matrix. Finally, interest rate levels can also be as important as the direction of their movement: when yields are high, any further hike tends to hurt equity markets. We suggest equity investors remain confident about the Fed’s policies when rates are low but pay more attention to how the Fed is able to keep rates at an economically sustainable level over the long term.
Introduction
Overshooting inflation has become an important concern of today’s capital markets. In the United States, the core inflation indicator, the Consumer Price Index (CPI) from October of 2021, indicated a 6.2% increase in inflation from a year earlier, which is the highest jump in over three decades. This has not accounted for the rise in energy prices, as the average U.S. gasoline price has risen as high as 52% in October in the last 12 months, fueling more pressure on the fragile consumer confidence.
The Federal Reserve’s (Fed) response to surging inflation is quite dovish. The Fed Chairman, Jerome Powell, testified at Congress on July 14 and said that tapering is still “a ways off.” Specifically, he sees that there is still a long way to go to reach the Fed’s goal of maximum employment. Still, the price stability goal can be ensured because the current supply constraints may only be temporary and concentrated in some industries, such as automobiles and semiconductors.
At the same time, many economists and investors have warned that the Fed may have already been behind the curve of a major inflation trend, threatening the global economy’s recovery. For example, Kristalina Georgieva, the managing director from International Monetary Fund (IMF), pointed out the two-track recovery challenge faced by the world, which means the slow vaccination in the developing world and the better-than-expected recovery in the developed world. There is the risk of sustained rising inflation that will push the Fed to tighten its monetary policy earlier-than-expected, potentially causing significant outflows from emerging markets.
How will equity stocks perform in facing the upcoming tightening environment? In this paper, we intend to provide a “reality check” by exploring the last 30 years of equity market history and focusing on the evidence derived from solid quantitative measures and proven financial records. We are going to use the U.S. 10-year Treasury bond yield (Bloomberg ticker: USGG10YR Index) as our proxy for the Fed tightening measure. We are using this as our proxy because while the Fed has so far fixed the Fed fund rate at 0, the 10-year Treasury bond yield is market-based (hence, more liquid), and analysts tend to use this long-term yield as the base for a discount rate to derive equity valuations. Therefore, the U.S. 10-year Treasury bond yield can be a good indicator for measuring the market sentiment of the strength of Fed tightening. Throughout the paper, we might use Fed “tightening,” “tapering,” or “rising rate” interchangeably; they tend to generate the same outcome with long-term yields rising.
Observations from 2021
Would equity stocks suffer in a rising rate environment? The answer is rather uncertain.
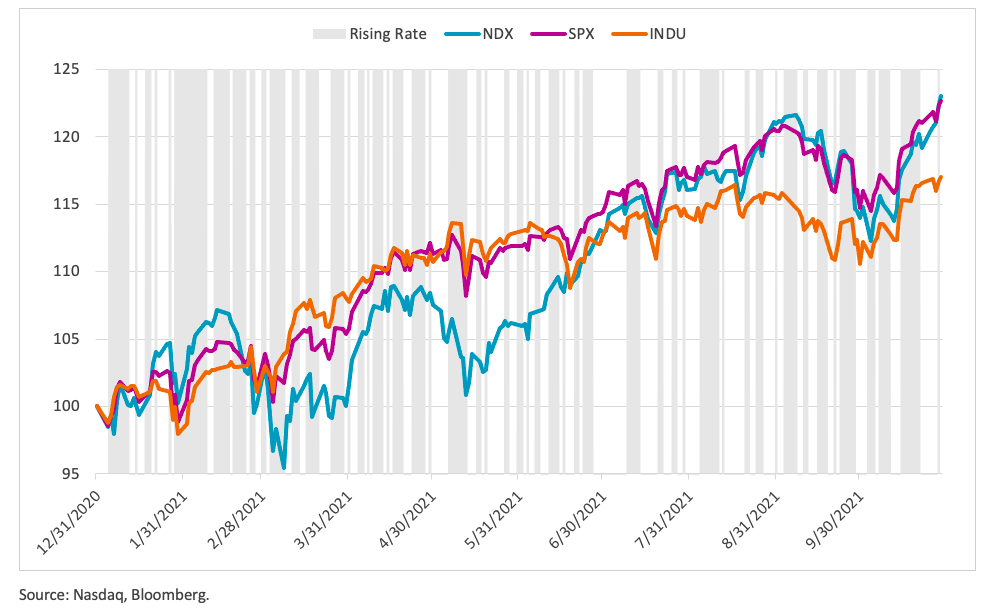
First, from our observation from the performance of the three major U.S. stock market indexes this year, both the prices of the Nasdaq-100 (NDX) and S&P 500 (SPX) are negatively correlated with the average yield change of 10-year U.S. treasury bonds. This means that whenever the market expects Fed tightening (soon), the equity market (NDX and SPX) tends to drop. Meanwhile, NDX’s correlation with the 10-year yield is the most negative (-0.3415), compared to a moderately dropped SPX (-0.1577) and the nearly unscratched Dow Jones Industry Average Index (INDU) (0.0638). This coincides with investors’ interpretation of NDX as more growth and tech-oriented, INDU as more Size/Value-oriented, and SPX as a more balanced U.S. large-cap.
Table 1: YTD Correlation with UST 10 Year Yield (12.31.2020 to 10.29.2021)

Chart 1: Performance of Equity Market Indexes in 2021 (12.31.2020 to 10.29.2021)
Observations from Longer History
In 2021, Fed-related sentiment has correlated with market returns this year. That said, given the short time horizon of our observations (just ten months) and none of the (Fed tapering) rumors becoming true, we might not have enough data to tell us the whole story. To derive a more statistically significant result, we decided to trace back the long history to discover the true interactions between the equity market and interest rates.
Instead of just looking at 10 months of data, we now have more than 30 years of equity price (NDX, SPX, INDU) and interest rate history (the UST 10Y yield). For the ease of the calculation, we have them resampled to end-of-month prices and yields, equating to a total of 441 months of observations from February 1985 to the end of October 2021.
Chart 2: The Long-Term History of Equity Prices and Interest Rates (Feb. 1985 to Oct. 2021)

Starting with the correlation coefficient again, comparisons of the co-movement within the YTD period, the long-term correlations between the equity market and interest rates were all slightly positive. This might suggest that at least from the 30 years’ history we observed, markets shouldn’t react so negatively to the expectation of Fed tightening as we witnessed in 2021.
Besides correlation, we are also interested in interest rate sensitivity. As measured by the price change per unit of interest rate change (1%), interest rate sensitivity tells us both the direction and the scale of equities’ price reaction to changes in interest rates. Based on the study, NDX has the highest (and) positive interest rate sensitivity among the three equity indexes, with a sensitivity of 2.0. It might suggest that, historically, growth/tech stocks should be expected to benefit the most from long-term yield pickups.
Table 2: Long Term Correlation and Interest Rate Sensitivity (Feb. 1985 to Jun. 2021)

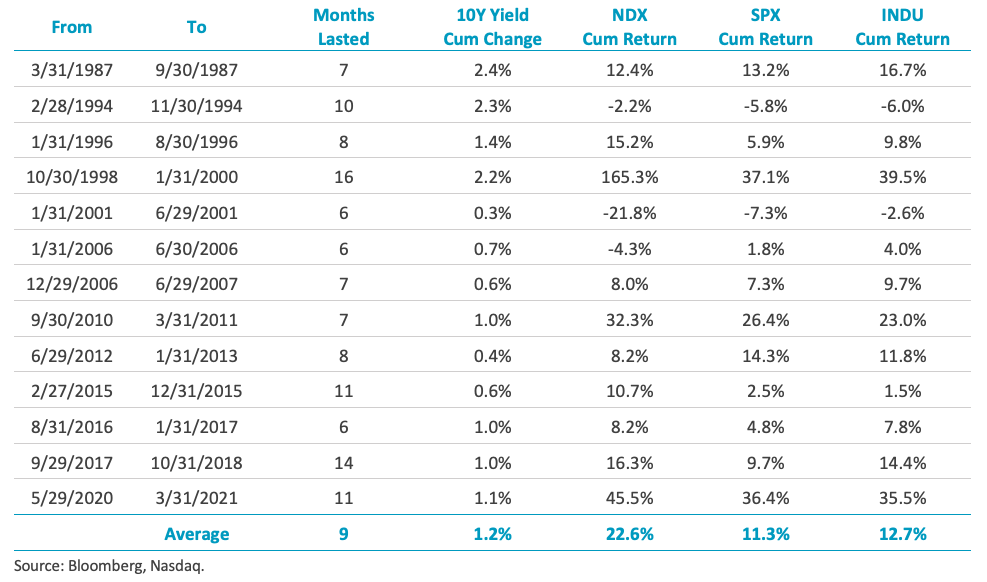
We can also confirm the findings above with a complete rundown of all the individual cases. In the following table, we listed all the periods with more than or equal to 6 months of rising interests. We also allowed for periods that included a minimum of a one-month decline in interest rates, but we capped the decline at25 bps. From the total observations of observations of13 cases, which included 1171 months (roughly a quarter of our total sample) of data, we found that NDX, on average, returned a positive 22.6% during the rising yield periods, while SPX and INDU returned 11.3% and 12.7%, respectively. This confirmed the first conclusion we drew from the interest rate sensitivity study - equities tend to benefit from rising rates, and growth/tech stocks, such as the NDX, tend to outperform in a rising rate environment.
Table 3: Long-Term Equity Market Performance under the Rising Rate Environment (1985 to 2021)
The rising rate environment is defined by the period with more than or equal to 6 months of rising interest rates, as measured by the US 10-year treasury yield, which also allows for no more than one month of correction with interest rates falling no more than 25 bps.
The Impact on Fundamentals
Recall that investors like to use long-term yield, adding some additional equity risk premium, to calculate a stock’s current fair value by discounting the equity terminal value. This means that if interest rates rise, a stock’s current value should shrink. Meanwhile, a growth stock’s value should fall more since its terminal value accounts for most of the future cash flows. That said, our findings appear to contradict the theory.
So, there must be something missing from our previous discussion. The equity valuation models commonly start from modeling a fixed stream of future (expected) cash flows, while the uncertainty of cash flows is discounted based on equity risk premium. This simplified assumption neglects the difficulty of forecasting two dynamic variables - future cash flows and the equity premium.
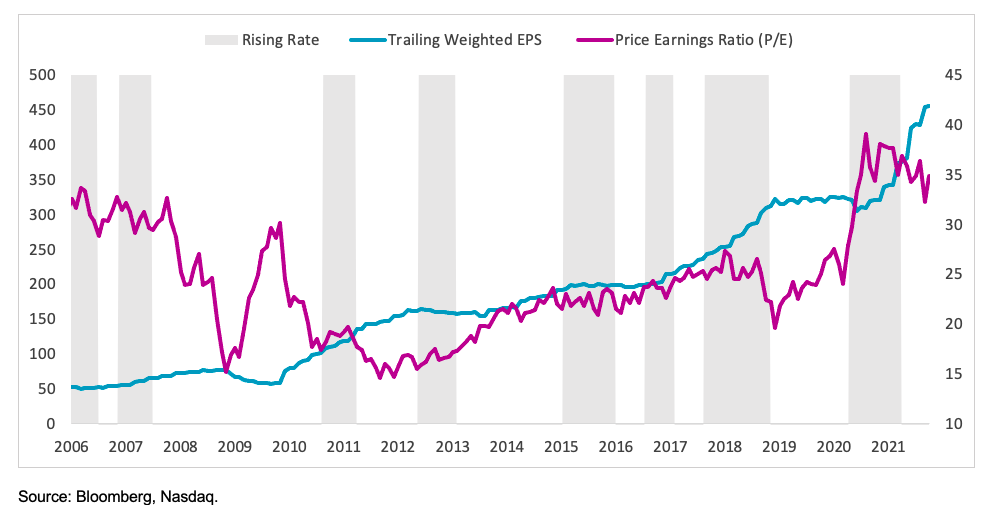
Our study includes index weighted Earnings Per Share (EPS) and Price-to-Earnings Ratio (P/E) data. The earliest available data are from 2001 (NDX), 1984 (SPX), and 1993 (INDU). The first available rising rate environment (Jan. 2001 to Jun. 2001) includes the Internet Tech Bubble (late 90’s early 00’s), so both EPS and P/E numbers are distorted. Therefore, we only calculate the long-term average starting in 2006, which is the start of the next rising rate environment (Jan. 2006 to Jun. 2006).
Chart 3: NDX Trailing Weighted EPS and P/E Ratio
The Impact on EPS Growth
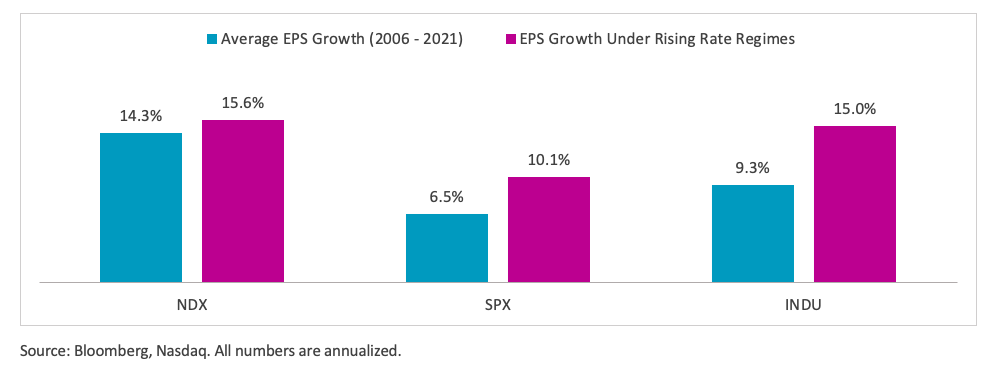
Our first measure is EPS growth. By comparing the annualized average monthly EPS growth during the rising rate environment to the long-term trend, we found that equities in a rising rate environment tend to enjoy higher earnings growth. The higher EPS growth is priced into the equity valuation and offsets the deterioration of discount rate due to rising rates. Meanwhile, NDX still enjoys the highest EPS growth in both scenarios, 14.3% for long-term average and improved to 15.6% under the rising rate environment. But we also observed stronger earnings growth from SPX and INDU. For example, the EPS growth of SPX under the rising rate environment is 10.1%, up from the 6.5% in long term average. This could be helped by cyclical value stocks, such as those in financial and energy sectors, which NDX historically is underweighted. But the more significant earning leaps actually came from INDU. INDU’s long-term average EPS growth is 9.3%, and it rose 5.7% to 15.0% in the rising rate environment, nearly the same level as NDX. INDU, the Dow Jones Industrial Average, is a price-weighted index of the 30 largest industrial companies. It may suggest that the larger the company in its industry, the higher the purchasing power, as it must raise prices and maintain profit growth during a rising rate environment.
Chart 4: Equities Enjoy Higher Earnings Growth in Rising Rate Environments
The Impact on P/E
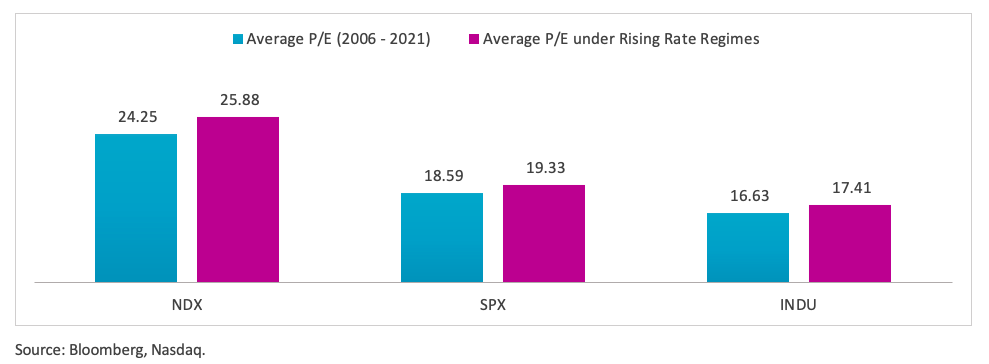
The second measure, historical P/E, indicates how investors favor or disfavor an investment and their equity risk premium preference. When a stock is popular, we are likely to see a high P/E and a smaller equity risk premium. The reverse is also true. During a rising rate environment, bonds are typically unfavorable to equities, so a popular trend in asset allocation is to sell bonds and buy stocks. The crowded trades in the stock market will bid up the P/E ratios and lead to an overall smaller equity risk premium than the normal period. What we observed in this analysis is that all three indexes (NDX, SPX, and INDU) revealed higher (more favorable) P/E under the rising rate environment than the long-term average.
Chart 5: Equities Enjoy Higher P/E Ratios under Rising Rate Environments
The Overall Impact on Pricing
During a rising rate environment stocks tend to experience better earnings growth and a more favorable valuation measure. The overall price performance of stocks should be the combination of both components. The following table is a simplified illustration of how stocks performed over the past 15 years. NDX 23grew 24.4% per annum (p.a.) in the rising rate environment, helped by 15.6% p.a. in earnings growth and 6.7% in valuation adjustment. Similarly, SPX 14.5% p.a. with 10grew 15.1% growth in earnings and 4.0% in valuation. INDU may grow 20.3% p.a. with 15% growth in earnings and 4.7% in valuation. INDU grew 20.9% p.a. with 15.1% growth in earnings and 5.1% in valuation. One of the reasons why it can be argued that NDX has been one of the most popular investment opportunities over the past 15 years is because of its outstanding history in earnings growth (we published another paper on this topic, see “Investing in the Nasdaq-100: How expensive is too expensive?”).1 The table below tells us that, even when the Fed has tightened historically, NDX has led in performance, with the help from both above-trend earnings growth and more favorable valuation measures.
Table 4: Breakdown of Equity Performance under the Rising Rate Environment (2006 to 2021)
Our study includes index weighted Earnings Per Share (EPS) and Price-to-Earnings Ratio (P/E) data. The earliest available data are from 2001 (NDX), 1984 (SPX), and 1993 (INDU). The first available rising rate environment (Jan. 2001 to Jun. 2001) includes the Internet Tech Bubble (late 90’s early 00’s), so both EPS and P/E numbers are distorted. Therefore, we only calculate the long-term average starting in 2006, which is the start of the next rising rate environment (Jan. 2006 to Jun. 2006).

The Case When Interest Rates Matter
The US 10-year treasury yield was as high as 11.89% in February 1985. It has gradually slid down over the past 30 years to be as low as 0.53% in July 2020. Although investors tend to follow the Fed’s announcements and try to figure out the next interest rate movement on a day-by-day basis, it’s important to keep in mind that the interest rate levels may also play a significant role in equity interest rate reactions. Why? This is because the interest rate should eventually be embedded into the cost of capital for corporations. Even though our previous investigations all suggest that rising interest rates can help equities, one shouldn’t expect interest rates should go higher and higher for the good of the capital markets.
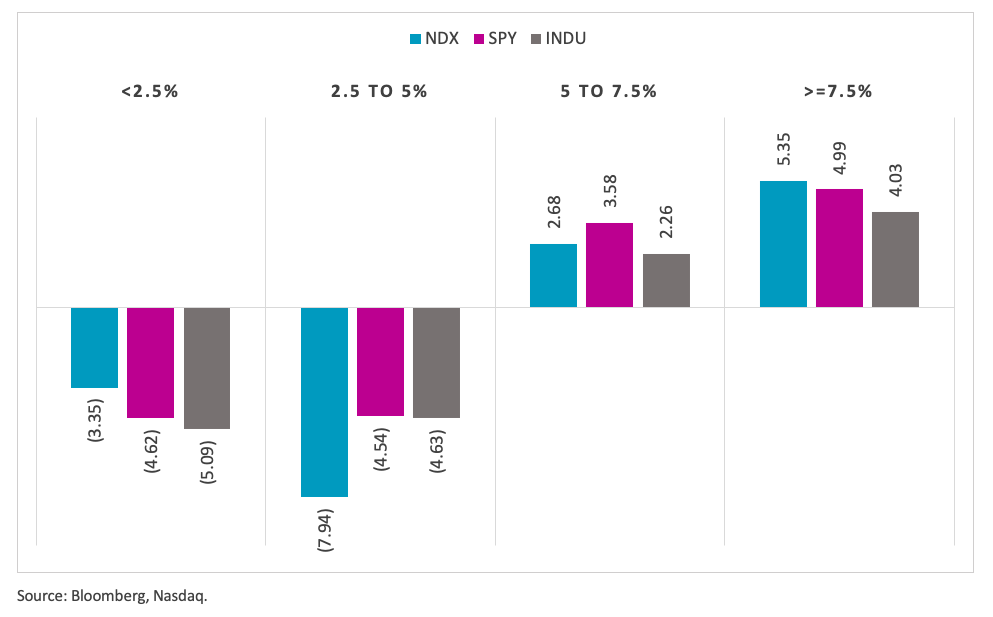
In the following case, we calculated the empirical duration of equity indexes with different ranges of interest rates: lower than 2.5%, between 2.5% and 5%, between 5% and 7.5%, larger than 7.5%. What we found is very interesting: equities have negative durations with interest rates when rates are low (in our case, 5%), which means that they benefit when interest rates rise from the bottom. But when rates are high, equities have positive durations. In other words, equities will fall if interest rates are high and keep rising. This makes sense and ties well with the stagflation fear in the real world.
Chart 6: Empirical Durations under Different US Treasury 10Y Yield Levels (1985 to 2021)
Empirical duration measures how an equity index is expected to perform when the yield of US 10-year treasuries falls by 1%. It is calculated as -1 times the difference of equity index average returns between the yield rise and yield drop divided by the range of yield change. A positive duration number indicates that the equity index will benefit from the yield drop; a negative duration number indicates the equity index will fall with the yield.
Conclusion
The Fed has placed itself in the headlines in today’s capital markets. If there’s a speech by the Fed chair stating that high inflation is just transitory, or if experts clamored about their worries over the Fed being “behind the curve,” the financial markets have reacted.
Market sentiment in 2021 has been quite negative towards the expectation of Fed tightening. We could measure it with the negative correlation between the equity indexes shown and the US 10-year treasury yield (table 1). However, when we look back over a longer horizon of over 30 years of equity market history, it was shown that stocks generally benefitted from rising rates (table 2). What we have observed are the positive correlations between interest rates and three major US equity market indexes: the Nasdaq-100 (NDX), the S&P 500 (SPX), and the Dow Jones Industry Average (INDU). Moreover, growth/tech stocks, tracked by indexes such as the NDX, should be expected to benefit the most from the long-term yield pickups. This is the first conclusion we drew from the interest rate sensitivity calculation (also in table 2) and the equity performance under the 13 rising rate cases from 2001 to 2021 (table 3).
To understand why that’s the case, we leveraged two important equity fundamental measures: P/E and EPS growth. Theoretically, the equity price performance can be easily explained by the following relationships:

Our analysis showed that NDX enjoys the highest EPS growth in both the long-term and during arising rate environment. The EPS growth gap between NDX and INDU during a rising rate environment is negligible: 15.6% for NDX vs. 15.1% for INDU. What has really helped the NDX performance during rising-rate environments is the advancement of its P/E ratio. NDX enjoyed a more favorable valuation, as its P/E grew an average of 7.6% from an already very favorable long-term level of 24.05. In comparison, both INDU and SPX P/E ratios were still in the range of 17 to 19. After considering both the P/E and EPS growth effects, our analysis showed that NDX outperformed INDU and SPX during a rising rate environment (table 4).
Finally, we reviewed that interest rate levels are just as important as the direction of their movement. It’s worth noting that when US 10-year treasury yields are high, such as above 5%, any further rate hike has tended to hurt equities, which was contrary to their normal responses when rates were low (chart 6 and appendix A). So, perhaps the major conclusion we can take from this short paper is that equity investors should remain confident about the Fed’s interest rate policies regardless of its timing of the normalization, given that it will start from such an ultra-low level. What investors should pay attention to, however, is how capable the Fed can be to keep interest rates under an economically sustainable level over the long term.
Appendix A
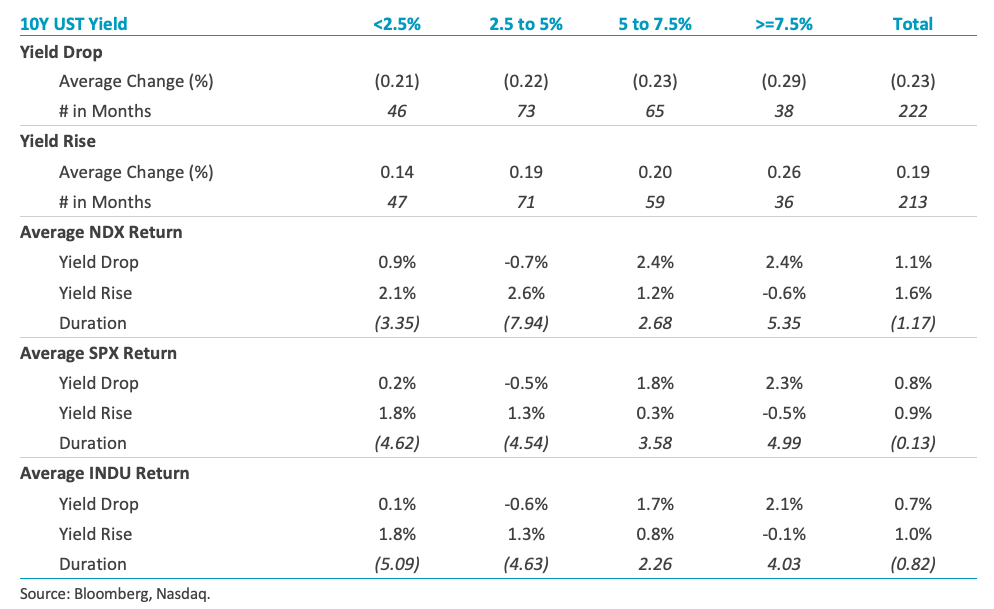
Equity Index Performance by Different 10Y US Treasury Yield Levels and Directions (1985 to 2021)
Empirical duration measures how an equity index is expected to perform when the yield of US 10-year treasuries falls by 1%. It is calculated as -1 times the difference of equity index average returns between the yield rise and yield drop divided by the range of yield change. A positive duration number indicates that the equity index will benefit from the yield drop; a negative duration number indicates the equity index will fall with the yield.
Nasdaq® is a registered trademark of Nasdaq, Inc. The information contained above is provided for informational and educational purposes only, and nothing contained herein should be construed as investment advice, either on behalf of a particular security or an overall investment strategy. Neither Nasdaq, Inc. nor any of its affiliates makes any recommendation to buy or sell any security or any representation about the financial condition of any company. Statements regarding Nasdaq-listed companies or Nasdaq proprietary indexes are not guarantees of future performance. Actual results may differ materially from those expressed or implied. Past performance is not indicative of future results. Investors should undertake their own due diligence and carefully evaluate companies before investing. ADVICE FROM A SECURITIES PROFESSIONAL IS STRONGLY ADVISED.
© 2021. Nasdaq, Inc. All Rights Reserved.
1. https://indexes.nasdaqomx.com/docs/NDX%20P-E%20Research.pdf

Nasdaq-100 Index
With category-defining companies on the forefront of innovation, the Nasdaq-100 index defines today’s modern day industrials.
Other Topics
Indexes Research and InsightsContact Us for More Information
Global Indexes
