What is Core Data?
A new IOSCO questionnaire asks a very American-sounding question: “What is core data?”
To determine this, they pose a single, basic question: “What market data is necessary to facilitate trading in today’s markets?”
The answer, based on some of the most liquid markets in the world, is: Not much.
Not much data is required to facilitate a trade
If we think about how many financial markets are at work, there is very little publicly available data. Consider the U.S. bond market, where more than $600 billion trades every day. There is no public record of trades, let alone quotes. FX and commodity markets aren’t much different.
So, arguably, all that is needed to make a trade is a quote from another counterparty.
So why is data beneficial to investors?
But there are obvious, although harder to research, problems with these less transparent markets for investors.
For a start, it’s hard for an investor to know if the prices they’re trading at are actually as competitive as they could be. That tends to harm less sophisticated investors the most. A study by Larry Harris in 2015 found that corporate bond investors didn’t trade at the best prices available on electronic bond markets 43% of the time, and those trade-throughs cost investors $500 million a year.
But even institutional investors can be harmed by non-transparent markets, whether they are trading debt, foreign exchange, Libor or commodities.
Clearly, there are significant benefits that investors get from transparent markets, from being aware of what the current price for an asset is to holding brokers accountable for their executions (both on and off-exchange). Historical data also helps portfolio managers make better-researched investment decisions.
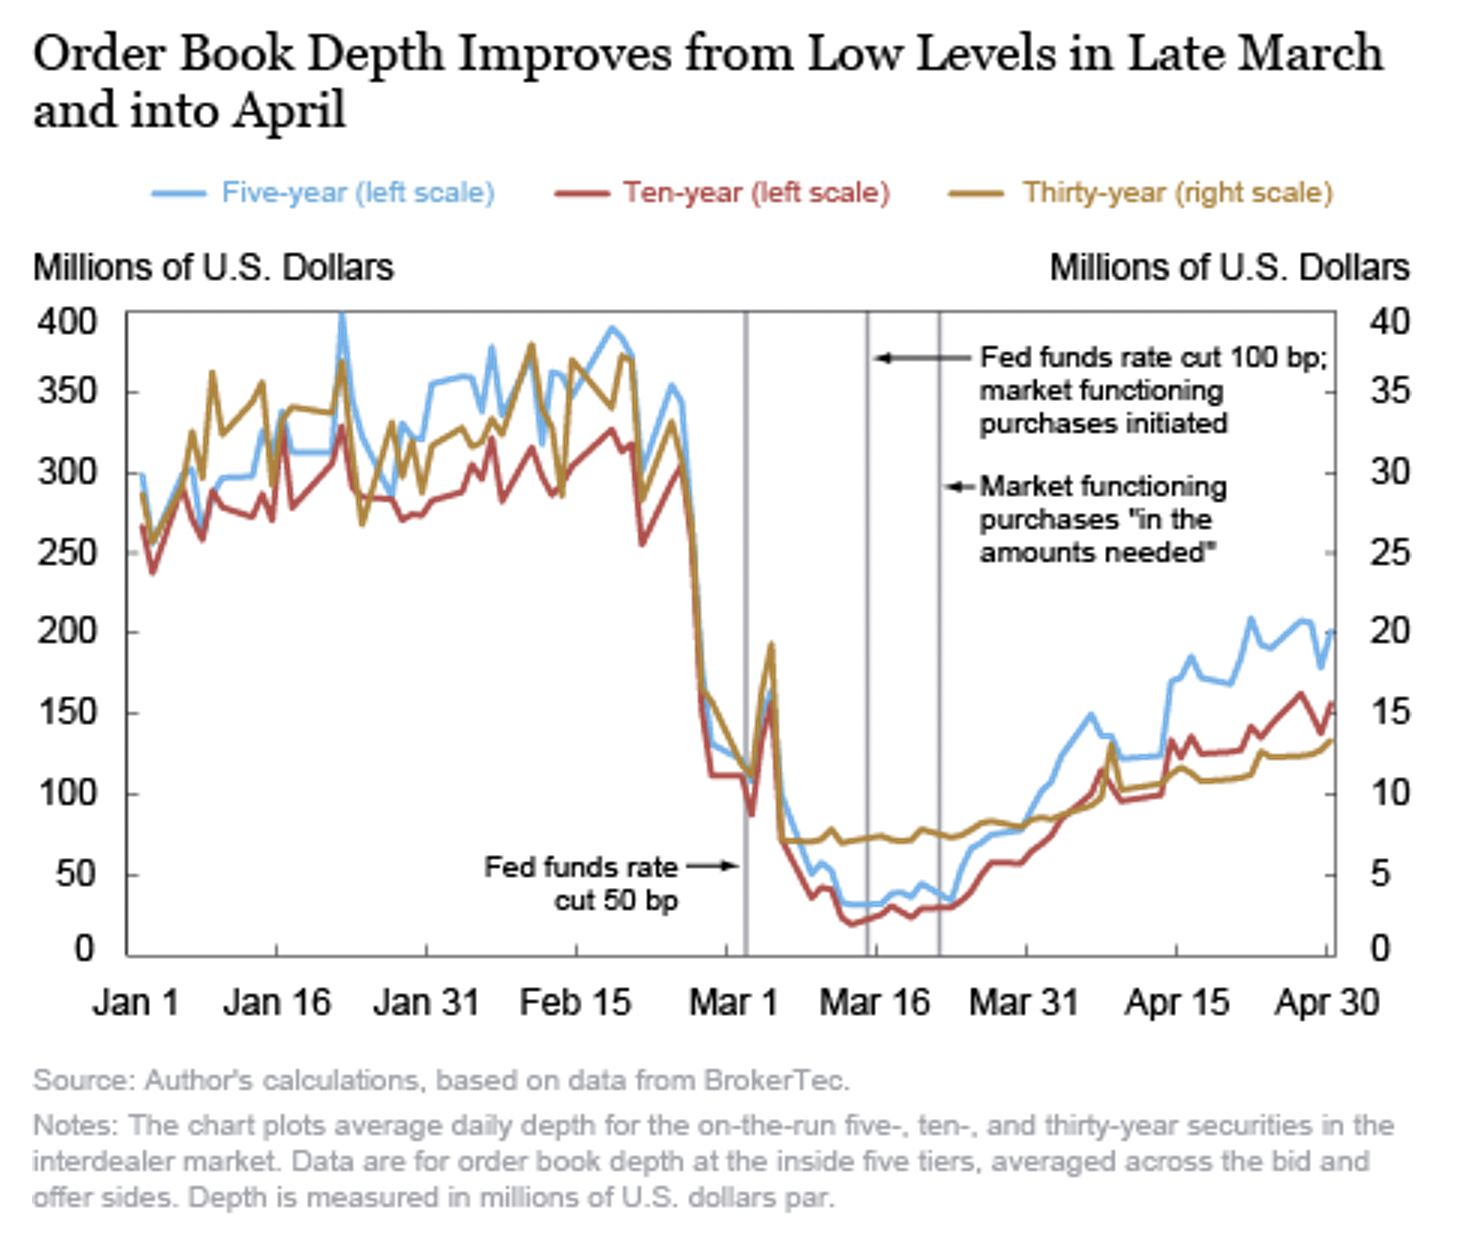
Non-transparent markets also often perform poorly under stress. During the Covid-19 selloff, there were reports that U.S. bond market liquidity evaporated. That was confirmed months later in a New York Fed study that used, ironically, quotes from the BrokerTec system (not the Fed’s list of Primary Dealers).
Chart 1: Depth in bond markets evaporated as the market reacted to COVID-19

An ICI report on the bond markets found price and yield dislocations that indicated that bond markets were not functioning efficiently or arbitraging mispricing effectively. Bloomberg called it a “Near disaster in U.S. Treasury trading.”
Under normal conditions, the majority of bonds don’t trade even once a day. That makes it hard to value portfolios and assess liquidity risks on new trades. But when you add a liquidity crisis with wider spreads and even less two-sided liquidity, bond indexes themselves become materially delayed and mispriced.
In contrast, the equity market provided increased liquidity to bond investors during the coronavirus crisis via ETFs. Instead of opaque markets with faltering liquidity, stock and futures exchanges provided a continuous stream of bids and offers in debt products. That meant, rather than ETFs trading at a discount to NAV, equity markets were, in fact, providing price discovery and liquidity to bond investors at a time when it was most needed.
Why do some markets have data while others don’t?
An interesting question then is: why don’t all markets provide public price and quote data?
The answer lies in the economics of data.
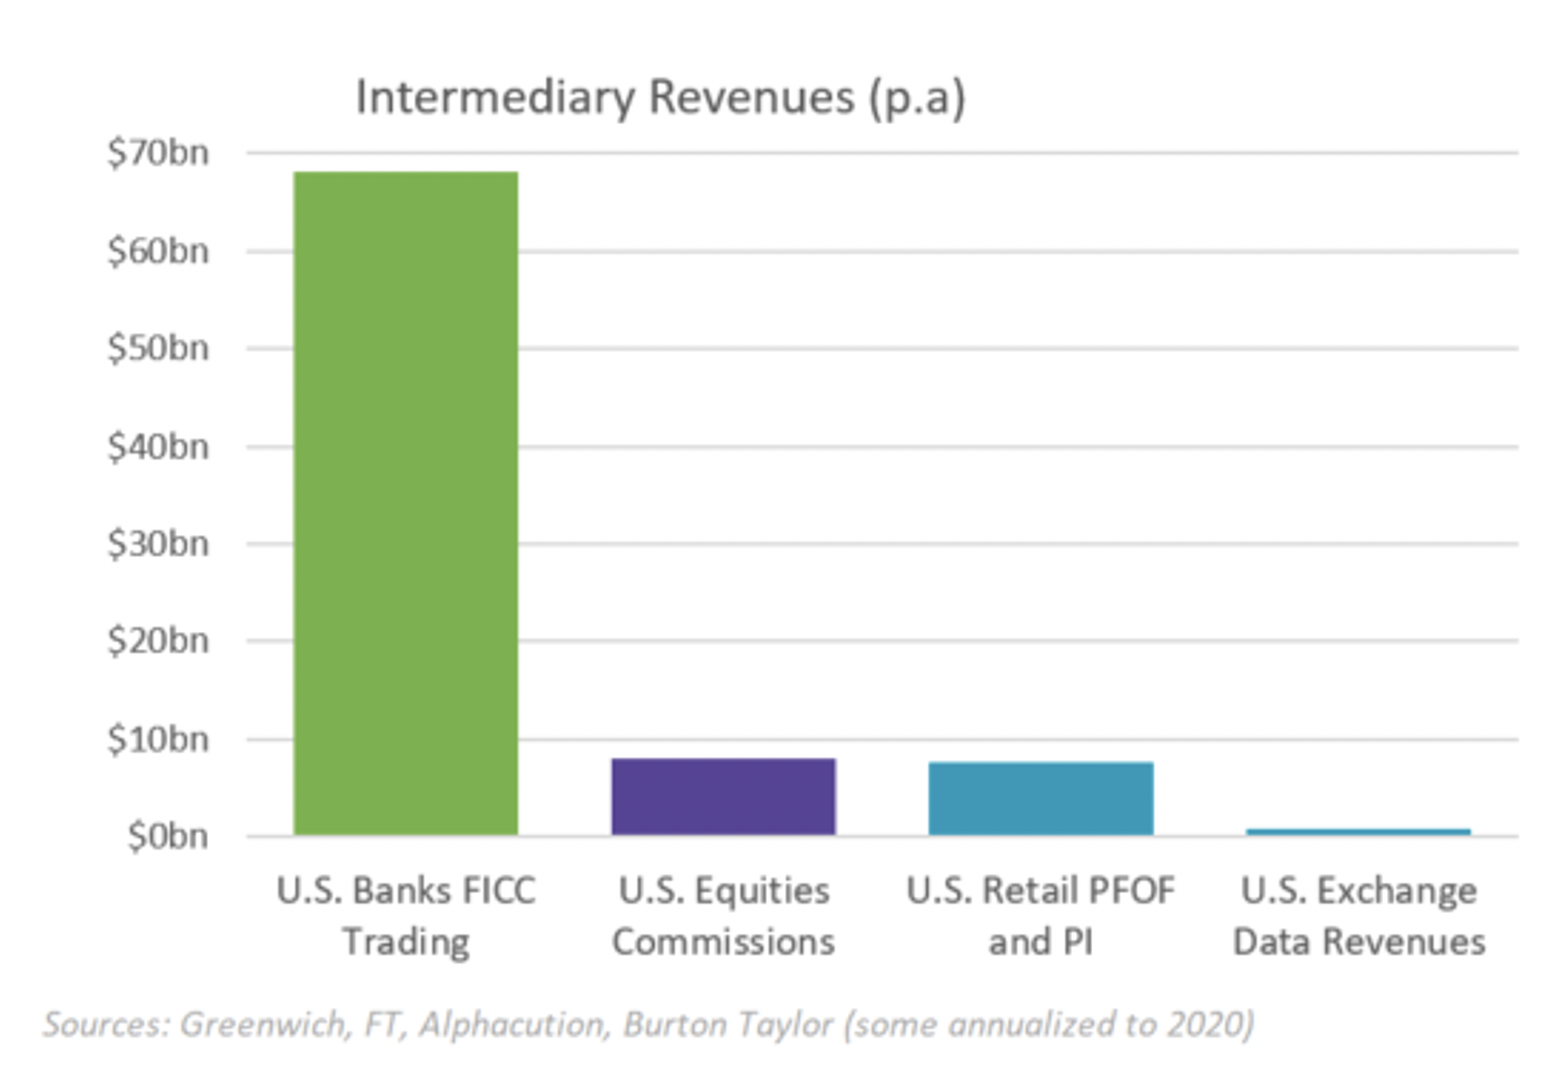
In non-transparent markets, those with data from multiple customers make far more money from trading than they could ever make selling the data to the public.
Chart 2: Revenues from private data are larger than for public data

This is important.
Yes, data provides a lot of good to the public. But that doesn’t make it a public good.
What makes equity and futures markets so different?
Public prices and consolidated quotes are much more prevalent in equities and futures markets. What makes them so different isn’t the public data—it’s the fact that they are exchange-driven markets.
By design, Exchanges are a centralized and independent place for all buyers and sellers to advertise (usually) anonymously, where competition for queue priority creates competitive quotes, and where advertising those quotes helps attract traders to the markets.
There is a belief that price data is a byproduct of trading, but the data comes first. Without prices to advertise, it’s hard for exchanges to attract trades.
Importantly, even in equities markets, there is an increasing proportion of venues that trade without producing any quote data. Ironically, many are doing those trades using exchange prices.
So what should data cost?
If regulators want to maximize the utility benefits of defining data as “core,” they need to deal with how to avoid misaligning economic incentives. If adding transparency to a market has benefits, clearly it’s important to align incentives to provide the data publicly in the first place.
It was interesting to learn about how the Nasdaq brought electronic quotes to the U.S. market 50 years ago, and depth well after that, for any traders who wanted to purchase them. That was well before exchanges became investor-owned.
When the SEC planned Reg NMS, it realized that users should pay their fair share for data going into the SIP. But what is “fair?”
Fixing prices and revenues, whilst it might be more “equal,” isn’t fair. Often, fixed prices lead to economic free riding, which can lead to excess fragmentation and some users paying less than they should.
Even the SIP charges retail users a lot less than professionals, but retail users also do a lot less trading. Then, as automated trading took off, the SIP charged computers “non-display” fees that were more than individual professionals. Considering how much trading a computer can do, that also seems fair to human customers.
In reality, there are a multitude of use cases that make data good for the public. As Chart 3 shows, there are a variety of users of market data, each with their own profits from the data (colors), appetite for paying for additional tech spend (horizontal axis) and the level of detail they actually want (vertical axis). It’s important to note:
- Some don’t trade at all, like media outlets.
- The majority of customers are humans, so quotes updating faster than ½ second is something that won’t affect their reactions.
- An investment manager has traders, portfolio managers and unit pricing teams—each with completely different needs in terms of speed and depth of data (and internal budget to buy it).
- Depth requires additional hardware, to handle over 10-times more messages. But we have shown only the top 1% of investors buy depth data now, and they’re the ones making the most income from data-related activity so they have a different cost-benefit than other data customers.
The SIPs customer classification still creates economic distortions. For example, retail discounts create free-riding by semi-professionals trading through retail brokers.
Another key question is whether a public feed should require all users to pay for all services and hardware, or pay a price closer to the investments they need (or want).
On this point, the U.S. market presents an interesting case study in who benefits from spending to speed markets up. Regulators have focused on the speed of the SIP for over a decade. That’s partly because Reg NMS uses the SIP to protect quotes and outlaw locked and crossed markets, making it a “pre-trade” price. Investments over the past 10 years reduced SIP latency from six milliseconds (ms) to less than 0.02 (ms). That’s an improvement none of the human customers can detect, but as the SEC’s new rules show, regulators realize a consolidated quote will never be fast enough for electronic traders.
Despite all the investments in the U.S. SIP, significant improvements in latency and capacity, and growth in retail trading, data shows SIP revenues have fallen since 2007.
Chart 3: There are many use cases for data, with vary in their ability to pay (colors), their appetite for significant tech investments (horizontal axis) and the amount of data they actually need (vertical)

How should data revenues be shared?
U.S. regulators designing Reg NMS also recognized the importance of good market quality, and designed an allocation of SIP revenue in proportion to those who contributed the most to price discovery. Exchanges at the NBBO more earn more revenue, and payments are also made for all participants printing trades to the tape.
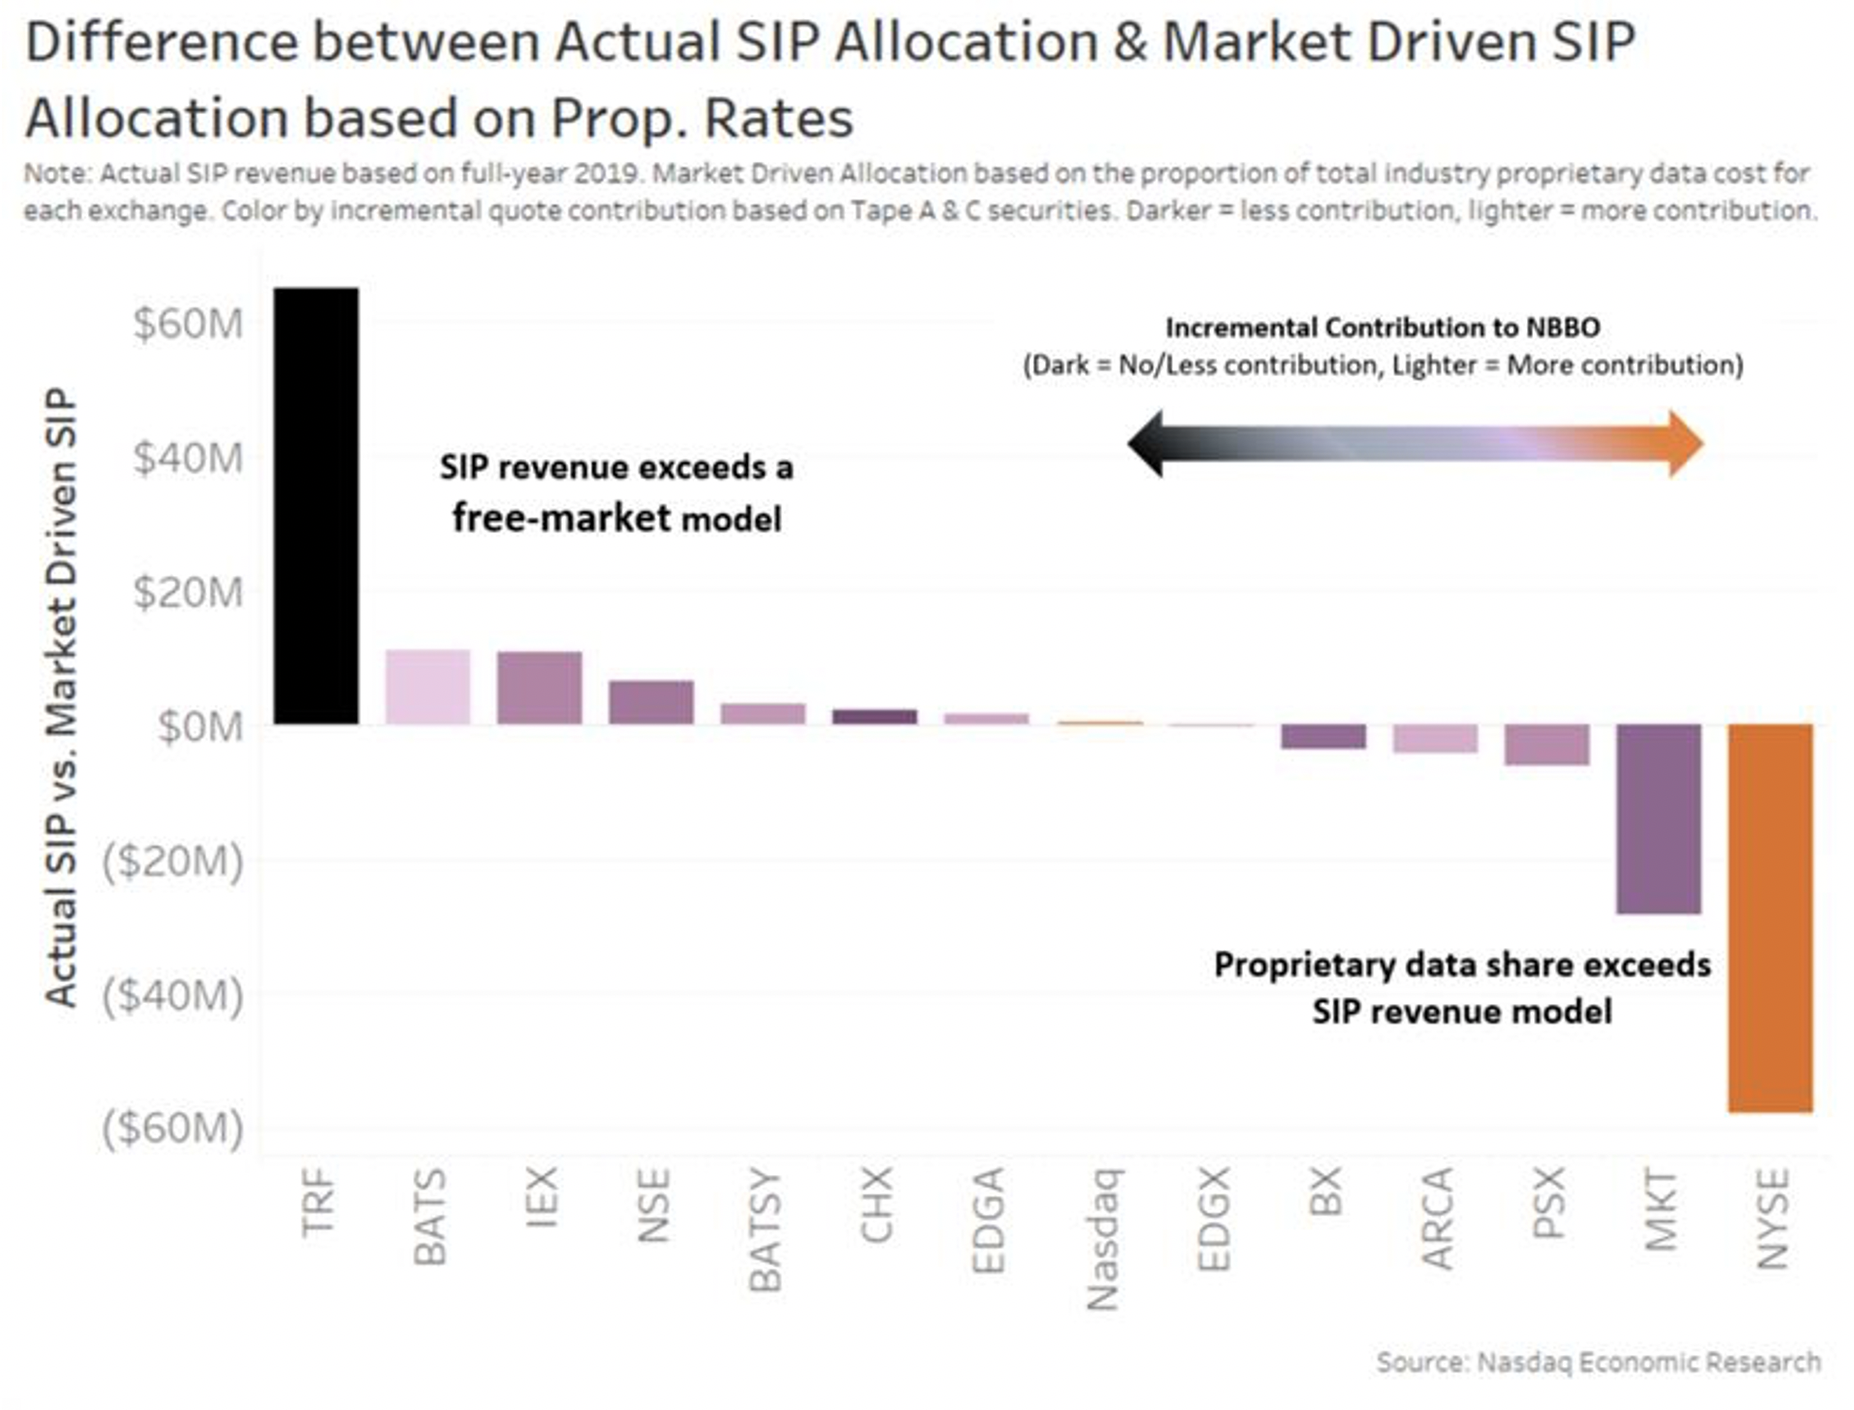
Sounds elegant. But even that has created unintended consequences. By rewarding all venues so “equally,” it ignores the duplication of fixed costs because of fragmentation. In contrast, we found that proprietary data fees are more directly related to market forces, with some small venues with little contribution to market quality unable to give away proprietary data. If we allocated SIP revenue based on proprietary rates, we can see that actual SIP revenues create excess data revenues for some of the smaller and less transparent venues (Chart 4).
Chart 4: SIP revenues exceed proprietary data rates in many venues that don’t compete for quotes

What is the most efficient mechanism?
The IOSCO questionnaire rightly asks: “What is the most efficient mechanism?” to distribute public data.
The answer is: It’s complicated. We know free is not optimal. As it misallocates resources, fails to reward price setting and leads to free riding.
We see the importance of understanding the different use cases, making equal suboptimal too.
It’s also clear from our research that most consumers have different needs. Including too much into core data forces many to pay for things they will never be able to use, or pay for technology that only more sophisticated traders want.
Getting the prices to be public in the first place is hard enough. Deciding who should pay for what to make things fair is a whole different problem to solve.
