What Happens in an Odd-Lot World?
We recently talked about how stocks with high prices see a higher percentage of odd lots, and how those odd lots aren’t required to be included in the National Best Bid and Offer (NBBO). In TotalMarkets, Nasdaq supported adding odd lots to the NBBO in a smart manner.
But what is the real impact of that? Do odd lots actually tighten “true” spreads that much?
It turns out the answer is yes, especially for the highest priced stocks. Let’s take a look at what the data shows:
NBBO changes in consistent and rational ways when odd lots are included
Recall Chart 2 from our last odd lots analysis showed that the percentage of the time that an odd lot was the “inside” quote increased as prices increased above $100 per share, and that at around $500 per share, the inside quote was around 60% likely to be an odd lot.
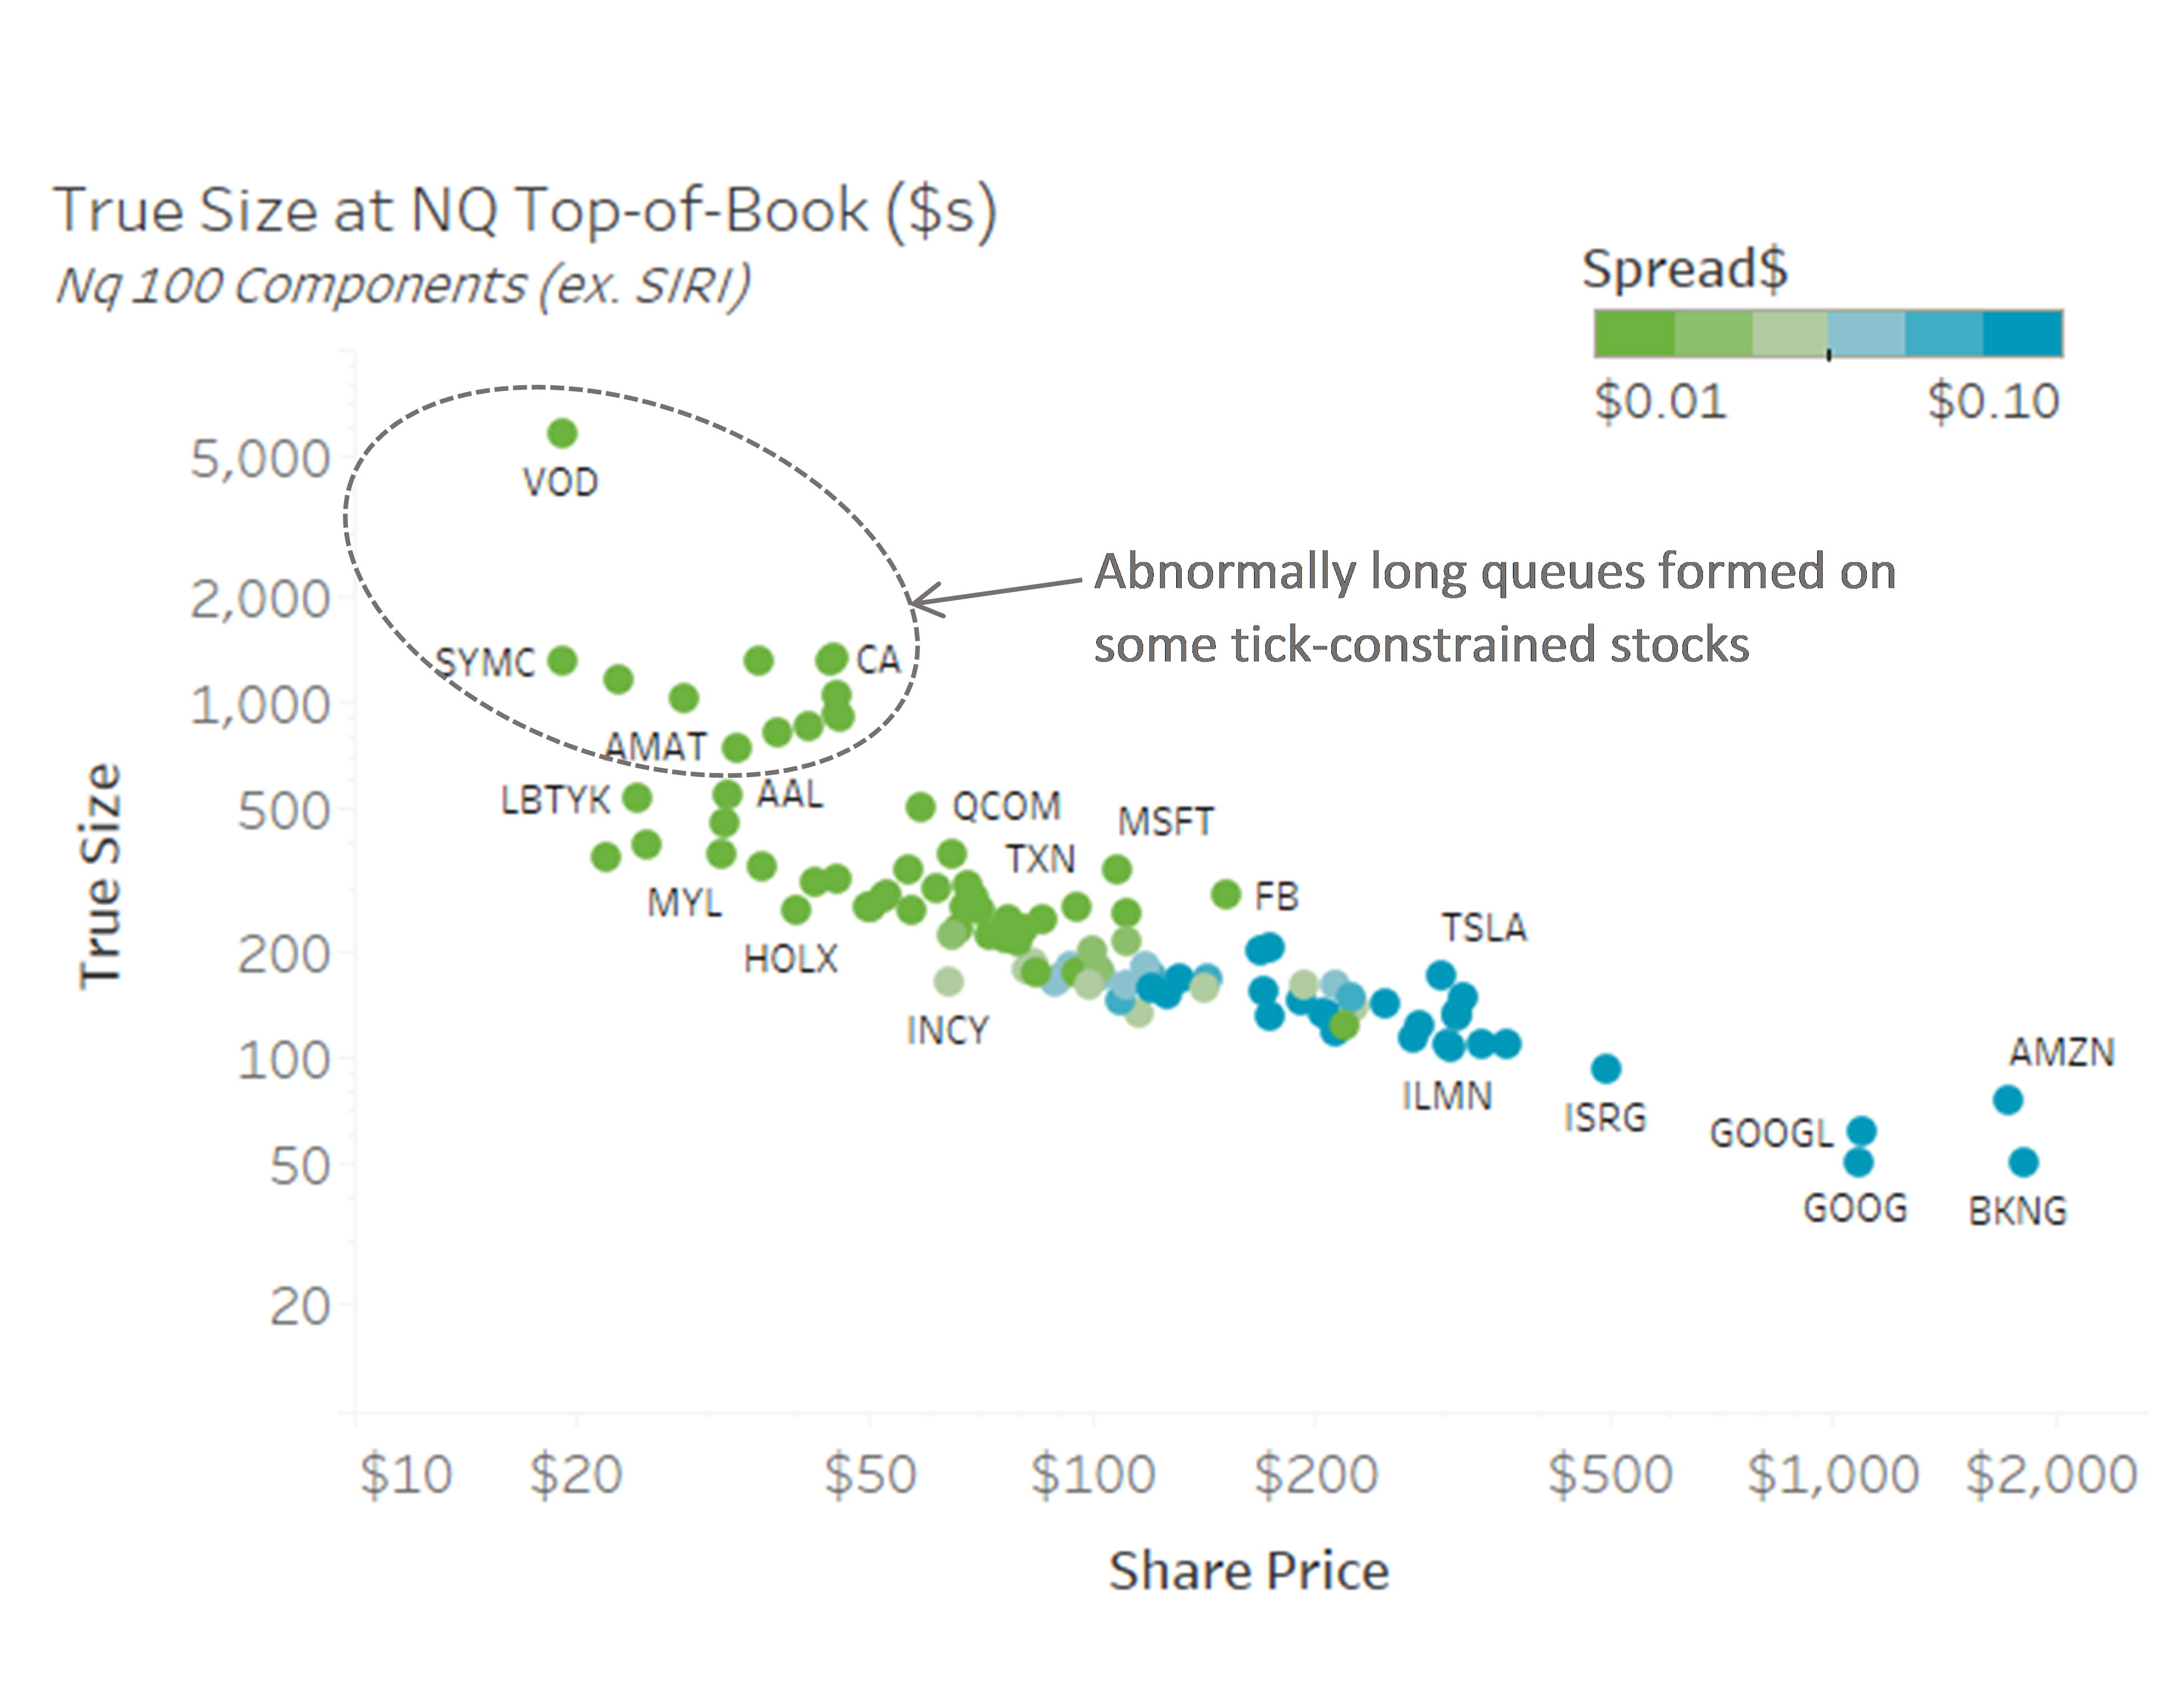
Not surprisingly that also means that if we included odd lots in the NBBO (let’s call it the “true NBBO”), the average depth of the true NBBO would also fall. Interestingly if we do this for all Nasdaq 100 stocks, we see (in Chart 1 each circle is a ticker):
- A fairly consistent downtrend throughout the stock price spectrum with a slightly upward trend as prices get higher (diagonal alignment of circles with a log/log scale)
- Tick constrained stocks (green circles) only seem to have abnormally high depth in some stocks (grey circle)
- Stocks above $500 average an odd lot on the “inside” (or best) quote
Chart 1: Size at top of book if odd lots are included is actually fairly constant

Source: Nasdaq Economic Research
That’s not really surprising given the cost of a round lot above $500 is $50,000, which is well above the market-wide average trade size of around $7,500.
NBBO depth is consistent in dollars
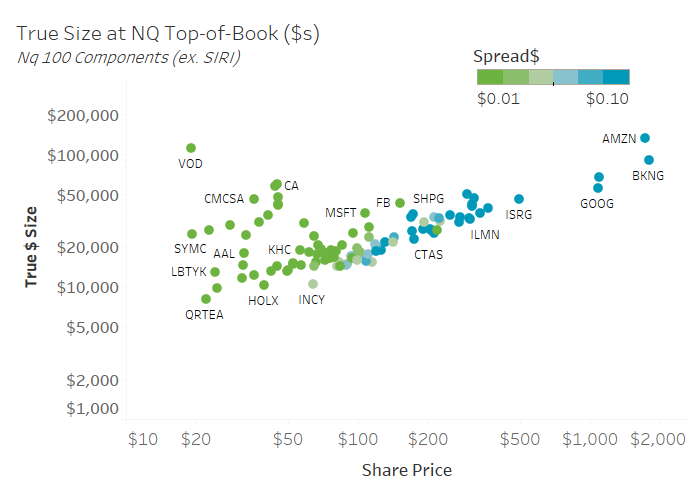
But what might be surprising, is that the value on the true NBBO is actually fairly constant across the market cap spectrum, and seems capped at around $50,000 even for the largest most liquid stocks.
Chart 2: Size at top of book if odd lots are included is actually fairly constant

Source: Nasdaq Economic Research
This data seems to indicate that in a world where stock prices range from $20 to $2000 one size doesn’t fit all. Perhaps we need to adjust how we think about “depth” and “liquidity” and look at it in notional value, not shares.
Smart traders use odd lots to contract spreads
Recall we also recently found that smart traders use inverted venues to compress artificially wide spreads. That happened for “tick constrained” stocks with artificially wide ticks (in basis points) caused by low prices.
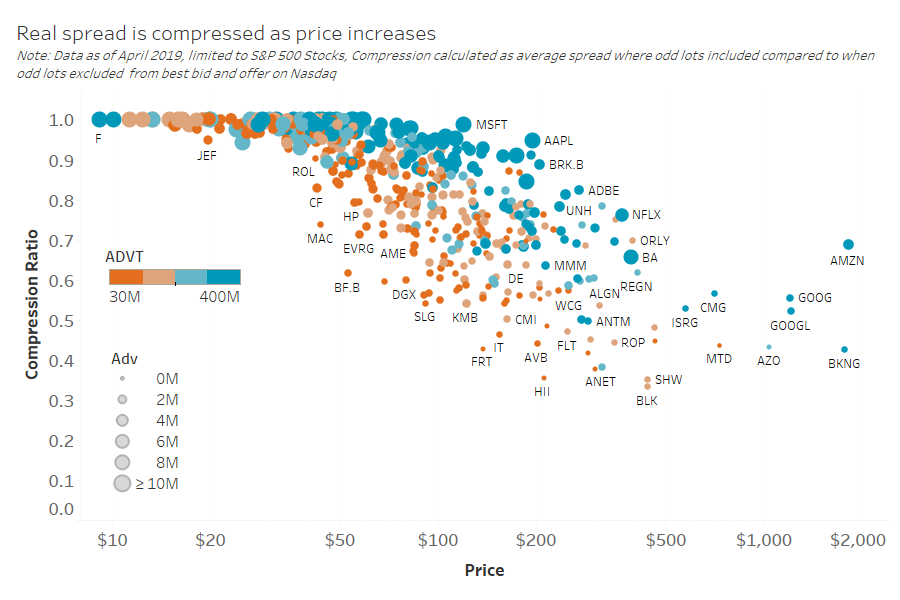
We see a similar phenomenon at the opposite end of the spectrum. Smart traders use odd lots to compress spreads for high priced stocks that are “round lot constrained.” In fact the data shows that traders use odd lots inside the official NBBO to compresses spreads more (Chart 3):
- The higher a stock price gets (for example the true NBBO for GOOGL is on average around 50% of the NBBO spread, or around 40 cents vs. 80 cents)
- For less liquid stocks (orange circles are below blue circles for the same stock price)
Chart 3: True NBBO Spreads compress more as stock price rises and liquidity falls

Source: Nasdaq Economic Research (Data from April 2019)
The market is more efficient than it looks
All this seems pretty consistent with our earlier analysis.
In V-is-for-volume we found that the supply and demand curves for stocks were unaffected by tick size. Said another way, less depth would accumulate at tighter spreads. And for stocks with high prices, we see that traders do “penny” the NBBO with smaller notional value orders. In essence they are weighing the exposure risk vs. the spread capture.
Importantly, although we see NBBO spreads widen in high prices stocks (recall the U-shape seen in The Data is Already Out There), the data shows that these high priced stocks are in fact just “round lot constrained.” Allowing odd lots into the true NBBO we see tighter spreads form, more in line with optimal spreads seen for large cap $100 stocks, with roughly the same notional depth of book too.
So when we look at the numbers, we see that what happens in an odd lot world isn’t odd at all!
Go here to sign up for Phil's newsletter to get his latest insights on the markets and the economy.
