The Nasdaq-100 Volatility Index (VOLQ) offers traders a consistent measure of expected volatility for the Nasdaq-100 Index (NDX). This measure extrapolates how concerned market participants are about future volatility in the near term. Understanding VOLQ and applying this knowledge to trading any instrument tied to NDX is an essential part of successful trading strategies. Additionally, VOLQ may help traders create systematic approaches to NDX as well as choose the best options relative to an individual’s outlook.
Why Volatility Indices Matter
Implied volatility of individual option contracts can be a function of time left to expiration as well as the strike price relative to where the underlying market is trading. The volatility calculated using an option is specific to that contract and day-to-day comparisons do not give us much information with respect to a market outlook. Any consistent measure of expected volatility, like VOLQ, offers a consistent look at expected volatility for NDX over the following 30 calendar days. This figure,
which incorporates a variety of option contracts in the calculation, would not be possible without a consistent methodology behind the calculation.
The Cboe Volatility Index (VIX), which indicates expected volatility for the S&P 500 (SPX), is the most commonly cited volatility index. VOLQ has similarities and differences with VIX. Both utilize index option pricing to calculate consistent 30-day expected volatility. However, the methodology and behavior of both volatility indices differ.
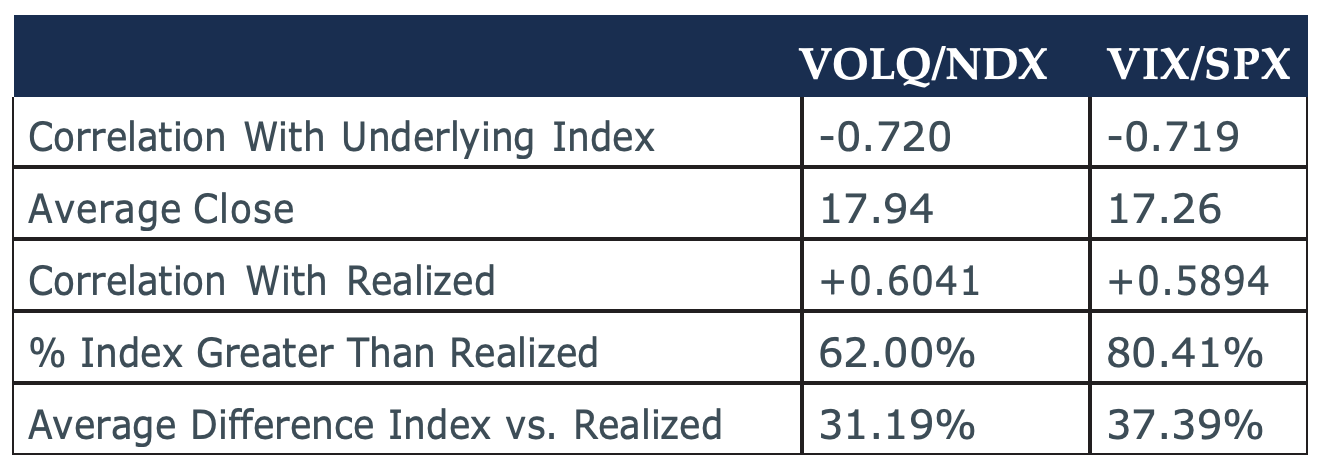
The VOLQ calculation is unique in that it uses at the money option contracts over four different expirations covering two before and two after 30-days in the future. The VIX calculation uses a large number of out-of-the money SPX put and call options expiring on Friday just before and just after a 30-day timeframe. The major difference, other than the underlying market, is that VOLQ uses near at-the-money options while VIX is calculated using the full strip of options that are being actively quoted. The following table compares VOLQ and VIX price action from January 2014 through May 2021.
Using Volatility Expectations For Successful Option Trading

Data Sources: Bloomberg / EQD Research Calculations
Both VOLQ and VIX have a correlation with their underlying markets very close to -0.72 and the average closing price for VOLQ is 17.94, slightly higher than 17.26 for VIX. Comparing VOLQ to subsequent realized volatility yields a correlation of +0.6041, slightly higher than +0.5894 for VIX versus realized volatility.
When further comparing the index closing prices to the subsequent realized volatility significant differences show up between VOLQ and VIX. VOLQ is higher than subsequent realized volatility 62% of observations, while VIX is overpriced relative to realized volatility over 80% of the time. A final figure shows that the absolute value of the average difference between VOLQ and realized volatility is 31.19% while the difference between VIX and realized volatility varies by 37.39%.
The final two figures from the table indicate that VOLQ is a better predictor of NDX price volatility than VIX is for SPX. The predictive ability of VOLQ results in a tool that helps traders determine the best strike prices when initiating trades. A factor that is covered later in this paper.
Another unique aspect of VOLQ relates to NDX option implied volatility having a distinct behavioral difference when compared to other broad based indices. A relatively small number of components, usually around 10 depending on market conditions, will make up close to half of the NDX’s market capitalization. Individual stock implied volatility usually increases when a quarterly earnings announcement is approaching. For example, Microsoft (MSFT) reports earnings each January, April, July, and October (earnings months). Using daily data from 2014 to May 2021, the average 30-day implied volatility for at-the-money MSFT options is 25.18% during the earnings months and 21.88% during the non-earnings months.
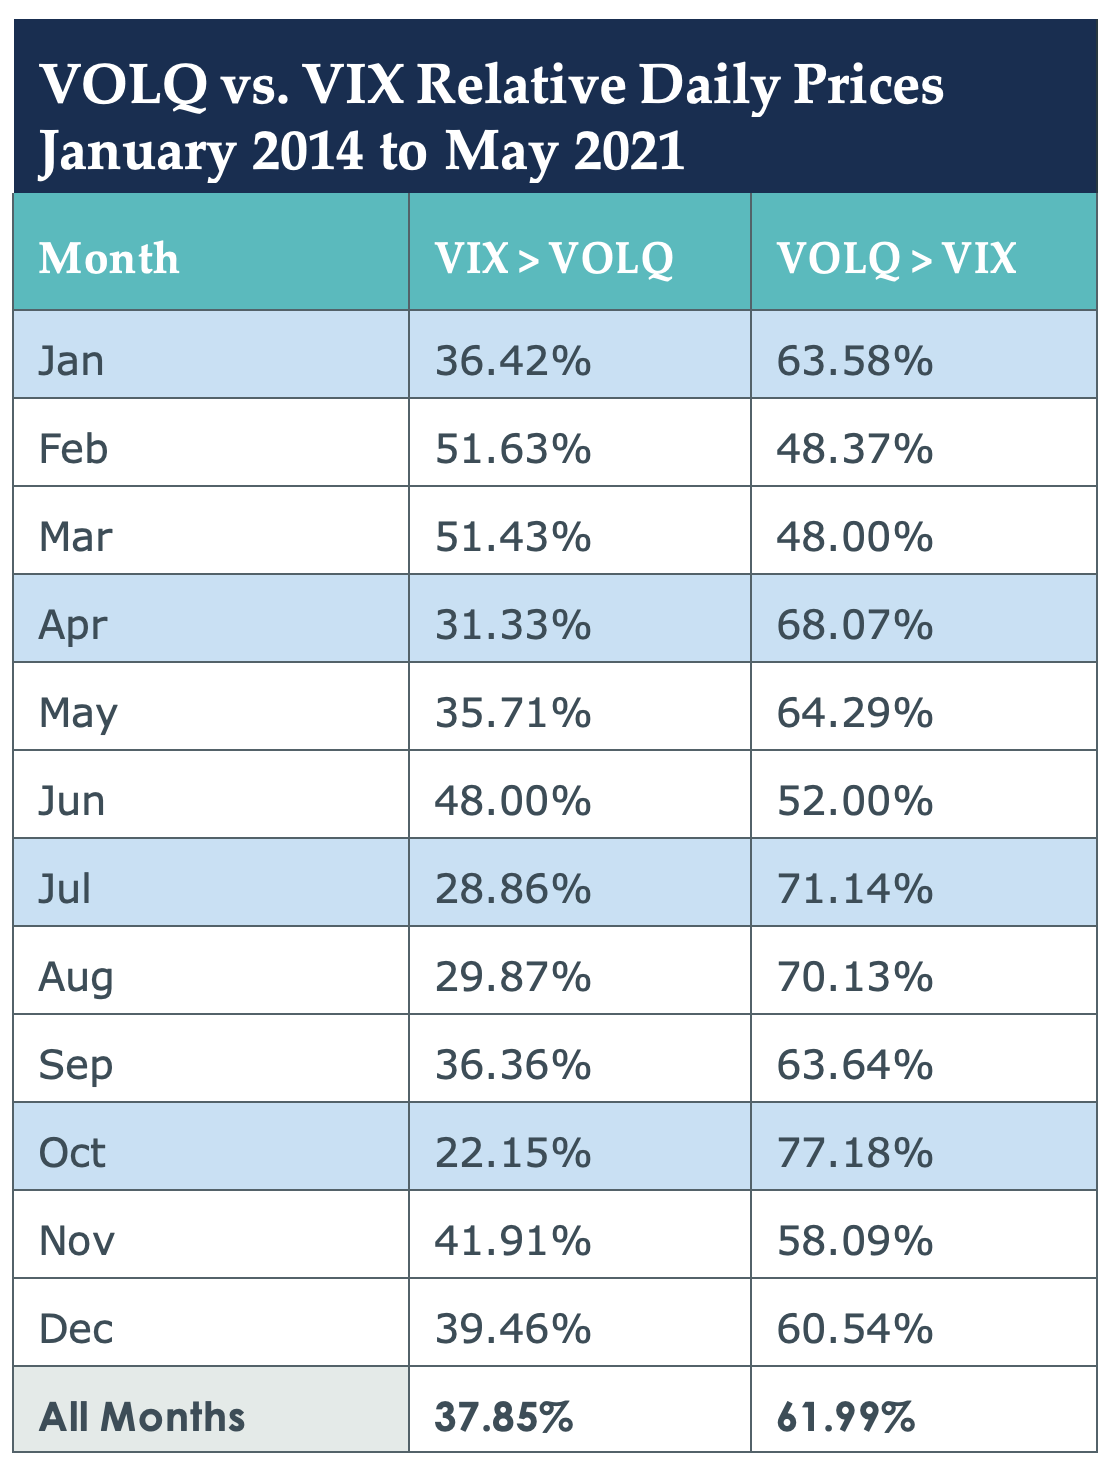
The larger components of NDX also report earnings during the same months as MSFT. A similar pattern emerges when comparing VOLQ to VIX during earnings and non-earnings months. The table below compares VOLQ and VIX closing prices on a monthly basis.

Data Sources: Bloomberg / EQD Research Calculations
The earnings season months are highlighted in blue on the table and the bottom row on the table shows the relationship between VIX and VOLQ over the full time period. In each of the earnings months, the number of days VOLQ closes higher than VIX is greater than the long-term average of observations. January is the only earnings month that is nearly in line with the long term VOLQ / VIX relationship.
The data demonstrates that at times VOLQ will incorporate the anticipation of large market moves for the underlying index due to a pending earnings announcement by one of the major NDX components. When considering NDX option trades, this aspect of the behavior of volatility may come into play.
VOLQ As A Market Indicator
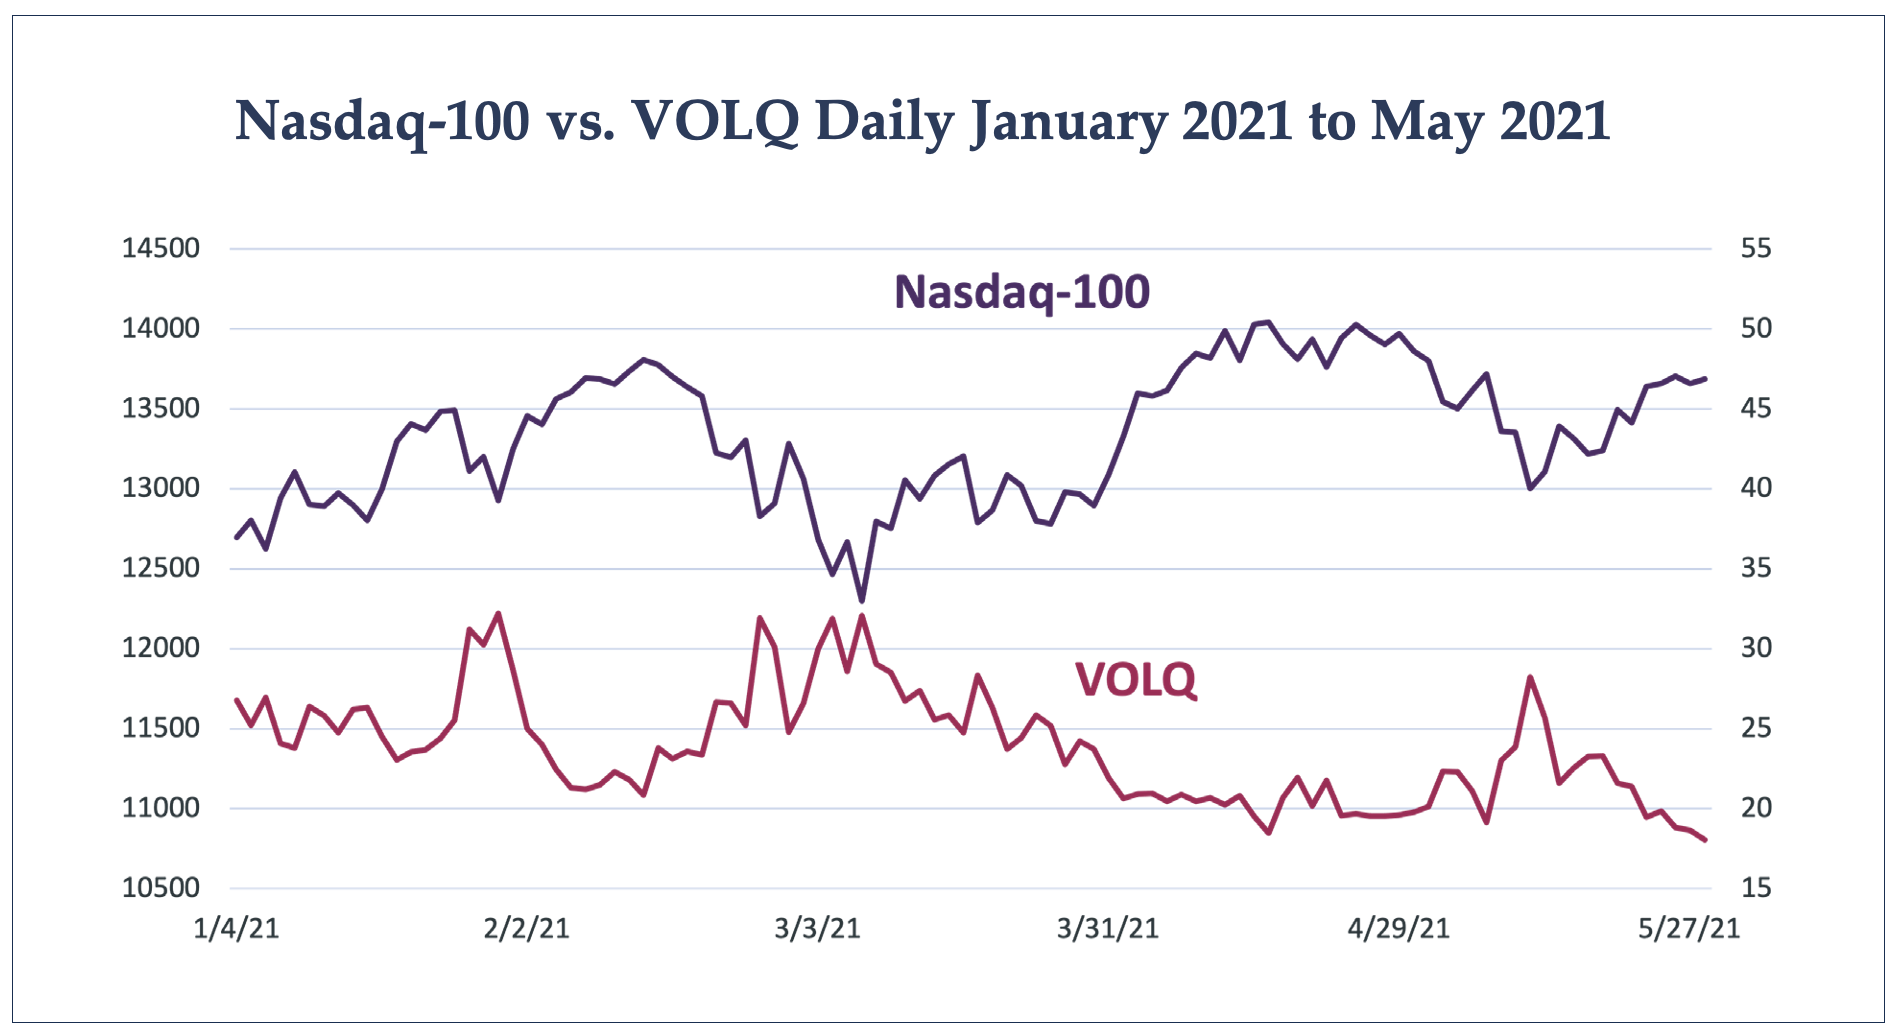
The following chart, showing the daily closing prices for VOLQ and NDX over the first five months of 2021, is typical of the price action for a broad-based index and related volatility index. Although VOLQ does have a seasonal aspect to price behavior it does react with quick upside moves when NDX comes under pressure.

Data Source: Bloomberg
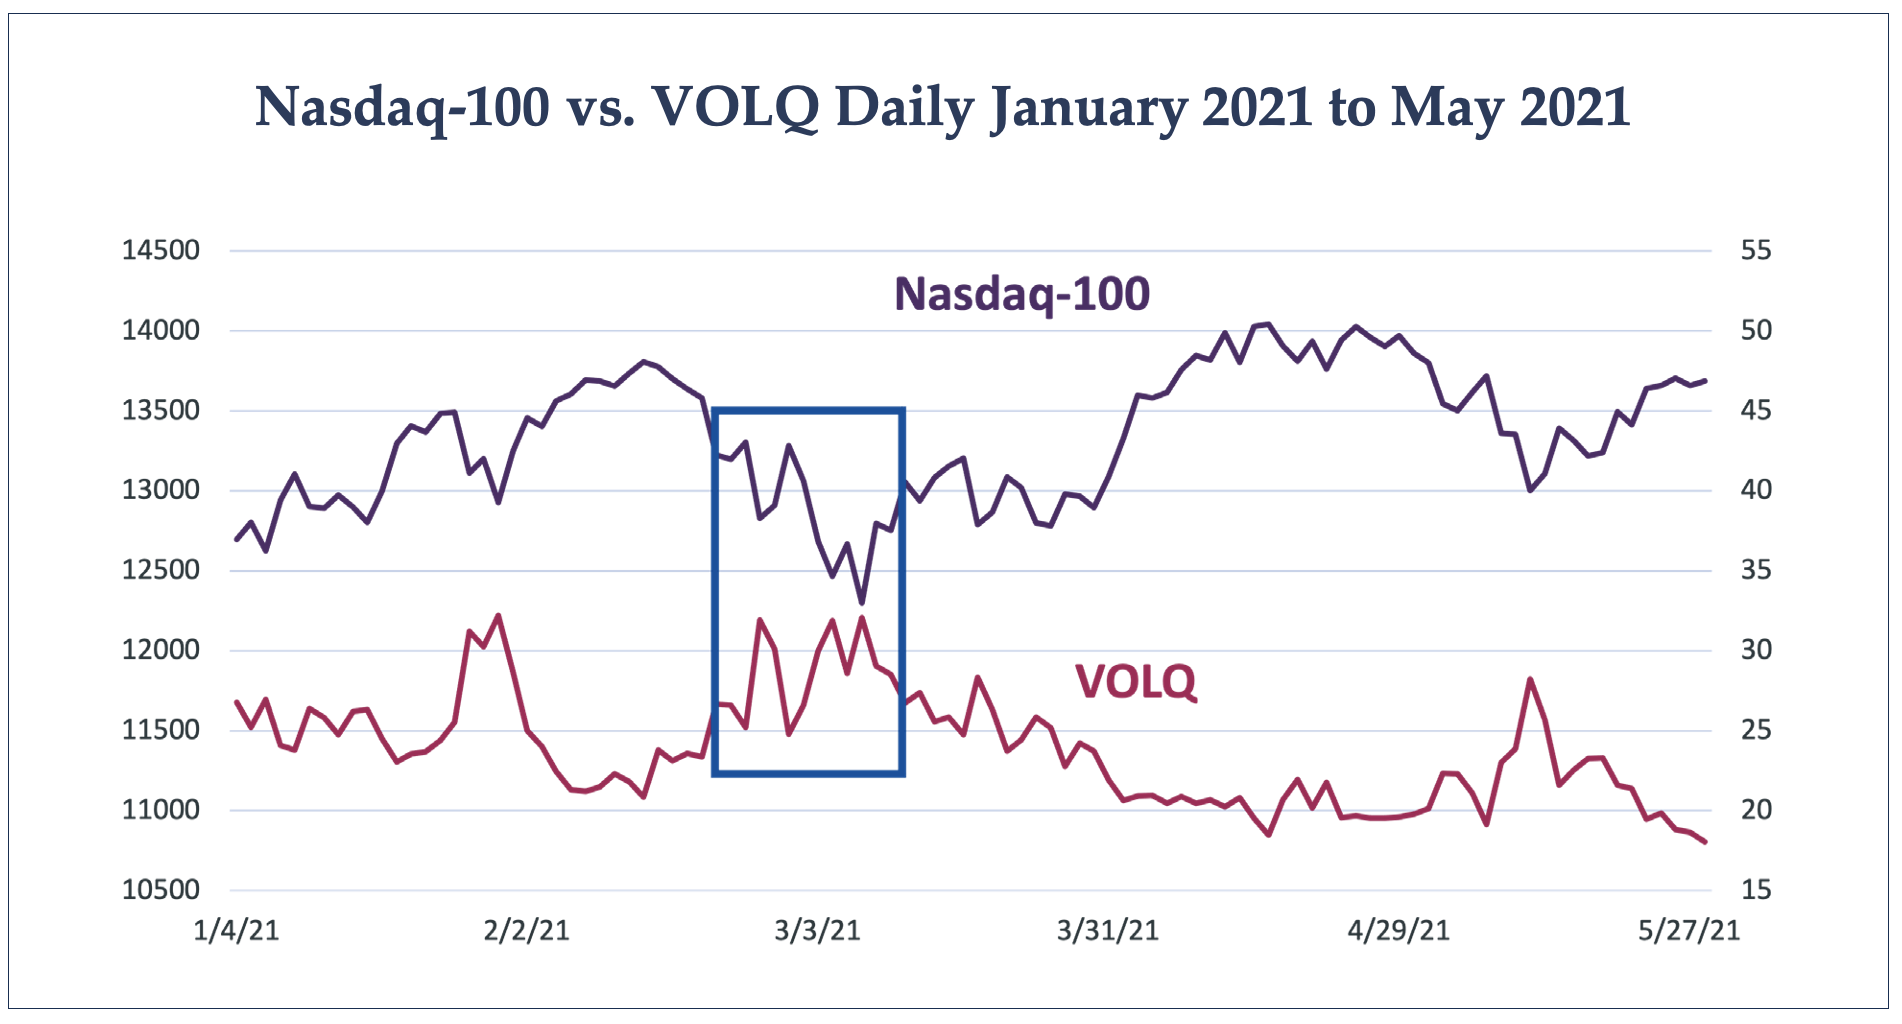
Technical analysts have adopted various volatility indices as market indicators. The specific methods vary, but in general, if the market index is making a new high and the volatility index is not making a new low it could indicate the end of the uptrend for the market index. If the market index is making a new low, but the volatility index is not making a new high this may be the end of a downtrend. The volatility index trending in the opposite direction is a confirmation of the market index trending in the other direction. The following chart shows an example of VOLQ indicating a down move in the NDX has ended.

Data Source: Bloomberg
The highlighted section of the chart is daily prices from late February to early March 2021. Note that the NDX makes a few successive lows, but VOLQ continues to reach a similar level to the upside with each of those new near-term NDX lows. A technical trader would consider the lack of new high from VOLQ to indicate that option traders are not concerned about the lower price levels in the underlying market.
Day traders also find volatility indices useful when confirming trends or signaling a trend change. The following price chart shows 5-minute data from January 15, 2021. Two areas on the chart are highlighted where two price divergences showed up during the trading day.

Data Source: Bloomberg
Box 1 highlights price action during the first two hours of the trading day. NDX bounced off a low and then tested the same price level about an hour later. VOLQ hit what turned out to be the high of the day in
conjunction with the first move lower in the NDX. The second price drop for NDX was met with a rise in VOLQ, but that move fell short of the first VOLQ spike earlier in the day. This non-confirmation of the second NDX drop is met with a quick rise for NDX and higher levels being held over the course of the day.
Box 2 shows NDX stuck in a range while VOLQ begins to trend higher. The VOLQ price action preceded the ultimate drop in NDX and a steady trend lower into the close of the day. Both instances are typical of the relative price behavior of VOLQ and NDX where VOLQ may give an early indication of a trend change or even an indication that a trend in either direction will continue.
Volatility Index Forecasts
Another use of volatility indices is to help determine the market’s outlook over various time-periods. Implied volatility, as indicated by option prices, is an annualized figure and volatility indices are also annualized. The implied volatility of an option specifically represents the expected one-standard deviation price change over the time frame of the life of the contract after adjusting for the time to expiration. The formula to make this adjustment can vary, depending on whether trading days or calendar days are used for the day count convention. The following formula is using 252 trading days as that is the most common number of trading days in the US each year.

Using Volatility Expectations For Successful Option Trading
For example, if there are four trading days remaining until expiration, and the corresponding volatility index is at 20.00 or 20% when put into the formula, a one standard deviation price change over the four-day period is equal to about 2.52%.

If the underlying stock is trading at 40.00, then the option market is indicating a one-standard deviation price change is equal to 1.01 (2.52% x 40.00). Stated plainly, the option pricing is indicating with 68.2% certainty that the stock price will be between 38.99 and 41.01 at expiration in four days. This also means if a trader is 90% certain the stock will land between those two prices the option market is offering an appropriate trade to take advantage of this outlook.
Admittedly, there are some flaws in using a volatility index in this manner. Still, VOLQ represents a consistent measure of volatility so comparing it to historical price action offers a good first step
toward identifying periods when options historically were over or under priced relative to subsequent moves in the underlying market.
VOLQ And Systematic Trading
A difficulty many traders encounter when creating systematic strategies is determining the best option contract to choose. A consistent measure of expected volatility, like VOLQ, offers traders a tool to compare market price action to what option pricing was expecting. For example, if a trader wanted to calculate how often a one-standard deviation move, based on the corresponding volatility index, occurs over a 30-day period they could compare the predicted range for the underlying market to the price at some point in the future. If through this analysis a trader found conditions where implied volatility is regularly overpriced this may lead to a systematic option selling approach. Conversely, if under certain circumstances the volatility index consistently underprices realized volatility then an option buying approach would make sense.
The predicted up or down 1-standard deviation 21 trading days in the future was calculated utilizing VOLQ and NDX. After calculating this prediction, the NDX price 21 trading days in the future was compared to the predicted 1-standard deviation range. The results in the table below show the percent of observations that NDX closed inside the 1-standard deviation range, how often NDX was outside this range, and how often NDX fell below down 1-standard deviation and above 1-standard deviation.

NDX falls inside the predicted range 70.91% of observations and outside 29.09%, indicated by the top data row or ‘All Days’. One interesting outcome is the price drops below down
1-standard deviation 9.05% and above 20.04% over the time tested. What makes this interesting is the common perception that markets exceed downside expectations more than upside expectations.
A basic trend indicator, the closing price versus a 20-day simple moving average divides the observations into ‘Up Trend’ or ‘Down Trend’. The overall results are the same in both cases, but there is an interesting outcome based on NDX in a Down Trend, or closing below the
20-day moving average. The down 1-standard deviation level is violated in only 7.64% of observations when the NDX is trending lower.
The long term average for VOLQ is 17.92, using that figure and rounding up a bit, a second test was run screening for times when VOLQ is greater than 18 and observations when VOLQ was below 18. Those results appear in the table below.

When VOLQ is greater than 18, the likelihood of violating up or down 1 standard deviation decreases to about 25%. This outcome is of interest as a higher VOLQ is associated with higher expected volatility, but this shows that when VOLQ is elevated it is a better time to sell NDX options. In addition, when VOLQ is over 18, the chance of closing below down 1 standard deviation drops to 6.47%.
These two brief examples of subsequent NDX price behavior relative to what is predicted by VOLQ demonstrate how having a consistent measure of expected volatility may be used to determine when certain strategies make sense as well as when they should be avoided.
Summary
VOLQ offers a consistent measure of expected volatility that incorporates at the money NDX options. The calculation that determines expected volatility comes directly from trading activity so VOLQ is a good indicator of the mind of the market at any given time. Traders focused on NDX or any of the many associated trading instruments that offer exposure to NDX are doing themselves a disservice if they do not closely monitor VOLQ. Finally, VOLQ is a useful tool for determining strike prices or even specific strategies.
The views and opinions expressed herein are the views and opinions of the author and do not necessarily reflect those of Nasdaq, Inc.

