Two Charts That Show ETF Investors are Getting Smarter
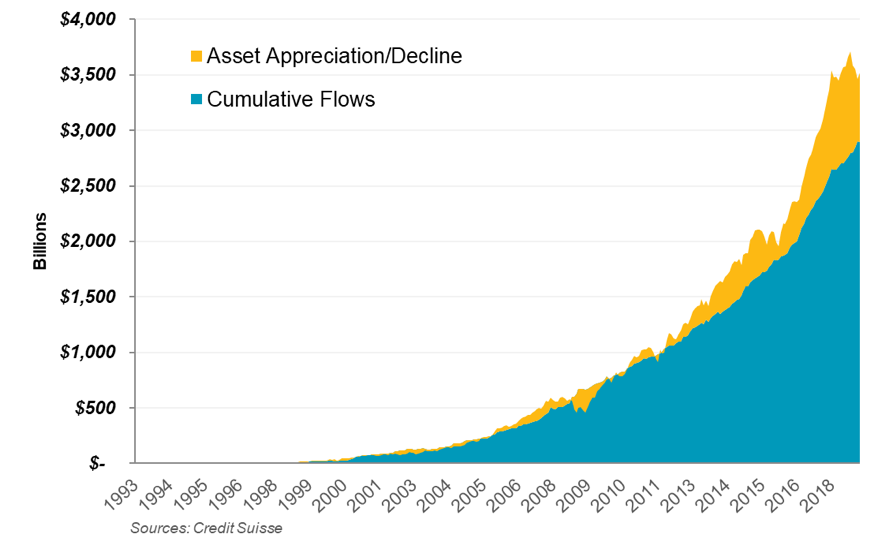
Exchange Traded Funds are one of the success stories of the U.S. markets over the past 25 years. Thanks to their flexibility and low management costs, investors have poured more than $2.9 trillion into ETFs.
The good news is ... assets currently in ETFs add to much more than that. Closer to $3.5 trillion.
ETFs have added over $600 billion to investors’ accounts
That $600 billion difference is a net gain that has accrued for ETF owners. That’s good news for ETF investors.
It also busts one common myth, that ETFs make it too easy for investors to trade, adding to their mistiming of the market, resulting in investors underperforming market returns.
Chart 1: Tracking ETF assets vs accumulated net inflows since inception

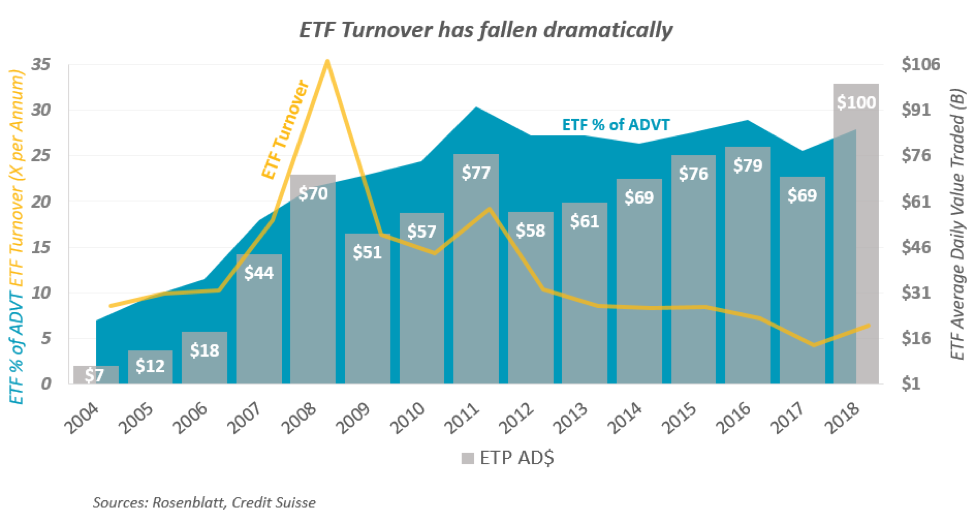
ETF turnover has fallen dramatically
That really shouldn’t be surprising. As ETFs have matured, longer term investors have increased their holdings—and as a result turnover is falling.
In fact, despite assets growing almost 600% since 2008, and the market rally of 178%, the value of ETFs traded has only increased 43% (grey bars in Chart 2). As the chart below shows, ETF percentage of notional traded has been constant at around 26% (blue area). Consequently turnover of ETFs is way down—we estimate ETF turnover has fallen from about 35x per-annum to just 7x now (yellow line).
Chart 2: ETF trading has risen more slowly, turnover has fallen and hold times have increased

That’s way above the turnover of an active mutual fund, recently reported by ICI to have fallen from 0.6x to closer to 0.3x per year. However ETFs are also a cost effective hedging tool—used by many just like futures. And in that context, we’d highlight that although ETFs are trading close to $100 billion every day that includes liquidity in international stocks, bonds and commodities as well as US stocks. For those worried about too much trading in ETFs, consider that U.S. Equity futures alone trade more than $357 billion each day.
Go here to sign up for Phil's newsletter to get his latest insights on the markets and the economy.
More from Economic Research
Three Charts that dispel the Price Improvement Myth
The views and opinions expressed herein are the views and opinions of the author and do not necessarily reflect those of Nasdaq, Inc.
The views and opinions expressed herein are the views and opinions of the author and do not necessarily reflect those of Nasdaq, Inc.
