Three Ways to Look at ETF Liquidity and Spreads
We’ve recently been looking at how spreads improve as value traded in a ticker improves.
Our latest charts show that although that trend holds for ETFs, the costs of trading ETFs are much cheaper across the spectrum.
Value traded is just one measure of liquidity. What we find when we look at turnover might surprise you. Investors and traders use ETFs very differently.
ETF spreads are much tighter than comparable spreads
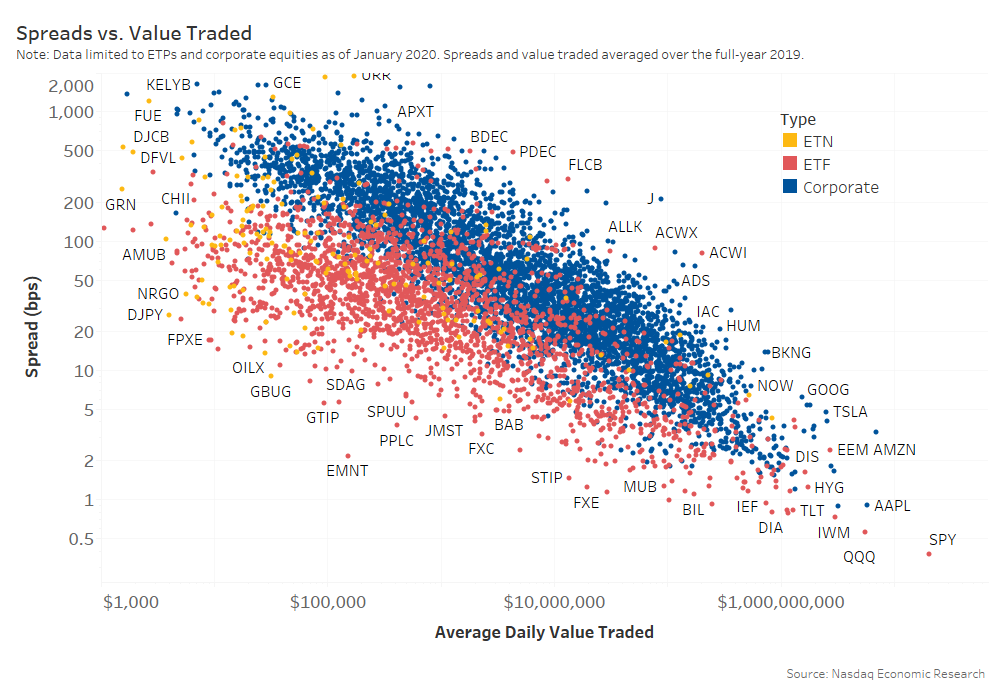
When we compare spreads (Chart 1, vertical axis) against value traded (horizontal axis) we find a consistent downward diagonal shape. This shows that as liquidity improves, spreads get cheaper too.
Interestingly though, when we compare ETFs (red dots) to stocks (blue dots) although the pattern is consistent, the spread costs for ETFs are almost always significantly cheaper for the same level of liquidity.
Chart 1: ETF spreads are consistently significantly cheaper than stocks of comparable liquidity

There are a few reasons for this, mostly related to the fact that ETFs also represent a portfolio of securities.
Firstly, the ETF can typically be arbitraged versus the underlying stocks. So ETF spreads compare better to the spreads of the underlying portfolio, which is usually much more liquidity than the actual ETF ticker.
ETFs also have more beta and less stock specific risk, which makes them easier to hedge with futures or other ETFs. That in turn helps market makers keep the price of the ETF competitive.
In fact, the liquidity that you see “on the screen,” representing the value that the ETF ticker trades, is almost always a fraction of the trade size a liquidity provider could execute in the underlying portfolio. That makes it much cheaper to execute large trades in an ETF, even if the actual ETF ticker seems thinly traded.
ETF spreads are much tighter for larger and more liquid tickers
Despite that, more liquidity still helps reduce spreads. That’s partly because liquid ETFs often have natural ETF bids and offers that can afford to be more competitive than the prices of the underlying.
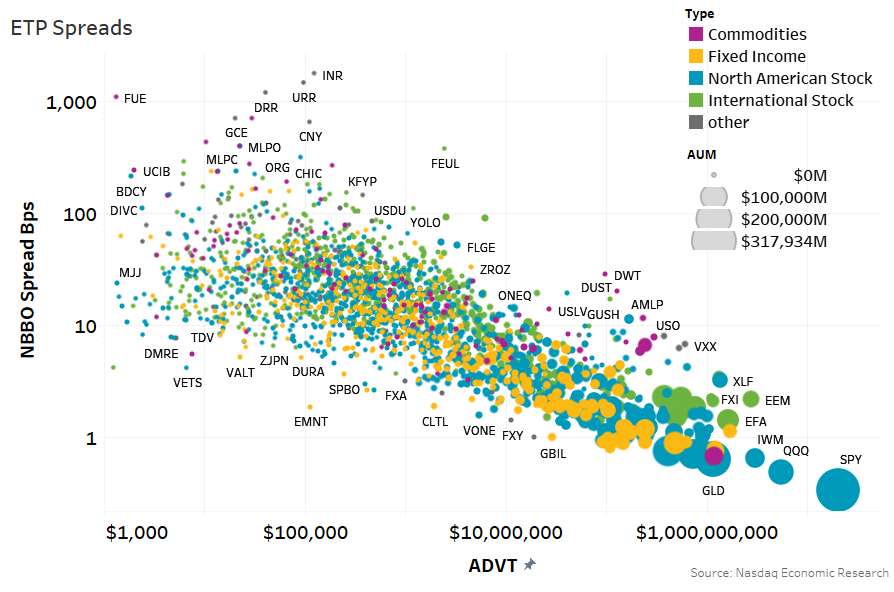
When we look in more detail at ETFs (Chart 2) and color by exposure and size by ETF assets, we see some other trends too:
- In general, the largest ETFs (large circles) are also the most liquid (further to the right). But not always. Some ETFs, like QQQs, EEM and sector SPDR’s have become “futures like” as we discuss later.
- Spreads are in general very low, 63% of all ETF tickers have a spread inside 20 basis points (bps), representing 99% of all value traded.
- Despite ETF trading making up around 28% of all stock market value traded, only a handful of ETF tickers trade with enough liquidity to give them spreads of less than 1 basis point
- Only around a dozen tickers trade more than $1 billion per day. SPY dominates with liquidity of $20 billion per day on assets of $318 billion. That’s around three times more liquid than the most liquid corporates, even though AMZN, AAPL and MSFT all have market cap around $1 trillion.
- S. stock ETFs (blue dots) tend to have tighter spreads than international stock ETFs (green dots) with similar liquidity. That’s likely reflective of the additional costs and risks hedging international stock ETFs, where the underlying markets are often already closed.
- Although bond portfolios typically have lower volatility, spreads on bond ETFs (orange circles) are similar to spreads on U.S. stock ETFs.
- With the exception of GLD (the gold ETF), commodity ETFs (purple dots) typically have relatively wider spreads. Note that many of these are based off futures, which require rolls and margin, while many are structured as ETNs (notes) instead of 1940-Act mutual funds.
Chart 2: Comparing ETF liquidity, assets and spreads (colored by underlying exposures)

ETF liquidity is also very concentrated. Just 120 tickers, or around 5% of all ETFs trade more than $100 million per day. However, this group adds to around $75 billion of daily trading value, or more than 85% of all ETF value traded.
ETF turnover indicates different ETFs attract different users
But value traded isn’t the only way to look at liquidity.
We’ve previously looked at turnover for stocks (trading as a proportion of shares outstanding). We found in our look at the turnover snake that the average large cap stock trades around 2.2x their shares outstanding each year. Thinly-traded stocks turnover was much less, but the smallest stocks actually had the highest turnover.
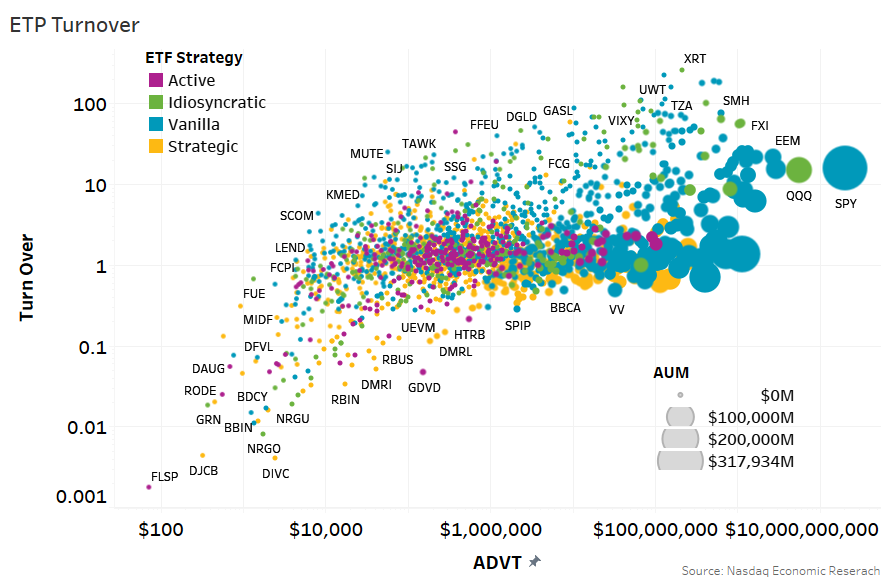
The same data for ETFs is quite different (Chart 3):
- Some ETFs trade a lot even though their assets are small (high dots with small circle size). Many of the ETFs with more than 10x turnover per annum are levered or sector ETFs preferred by hedge funds and professional traders. These are almost all “vanilla” index style portfolios.
- In contrast, active, smart beta and strategic ETF tickers (yellow and purple dots in Chart 3) have much lower turnover than a typical stock.
Based on these observations, it seems that hedge funds and professional traders use ETFs in different ways than many longer-term investors.
Those looking for hedges or short-term tactical exposures are understandably drawn to the liquid and predictable factor exposures that many large index ETFs offer. By focusing on a few tickers, market makers gain from economies of scale, making spreads even tighter. Many of these ETFs are used in similar ways to futures.
Meanwhile, those buying ETFs with stock selection seem to be much more interested in longer-term investing. That’s also consistent with a prior study that found retail appear to dominate trading in smaller cap ETFs.
Chart 3: Comparing turnover

At the other end of the spectrum (the left side of these charts) are a large number of thinly-traded ETFs.
The spread results show that thinly-traded ETFs don’t suffer from a lack of liquidity in the same way that corporates do. Spreads are much cheaper than thinly-traded corporates, even for ETFs that don’t trade every day.
Although ETFs with the lowest turnover are also those with the smallest average daily trading, as well as typically having a very small asset base. There seems evidence that very low liquidity, which brings wider spreads, can eventually stifle trading completely, making it even harder to make those ETFs successful.
Overall, the news for ETFs is good. There is significant liquidity at very cheap spreads for those doing a lot of trading. There are also competitive spreads for more mutual-fund-like stock selection ETFs that retail investors seem to increasingly appreciate.
