Three Charts Dispel the “Price Improvement” Myth
We all know spread capture is important. But sometimes how you do it affects how much value you add.
One of IEX’s favorite charts is their “price improvement” chart. Thanks to the way they calculate it, they typically do well – although they often place second to Chicago, which they have in the past left off the chart.
But “price improvement”, the way they calculate it, is an unfair metric to use to measure performance of institutional customers– as we explain below.
Where Does Price Improvement Come From?
Price improvement is actually a term used in Reg NMS rule 605. It’s designed as a measure the execution quality of marketable covered (held) orders. That means it only applies to orders that would be crossing the spread.
Price improvement is a very useful metric for retail orders. That’s because many retail orders are actually filled by wholesalers, so measuring their fill price versus the National Best Bid of Offer (NBBO) ensures they are getting filled no worse than if they traded on exchange.
Importantly (for this debate), Rule 605 has a concept of an “at the quote” order, representing a limit order at the near-touch. By definition, those limit orders don’t have price discretion, and so Reg NMS doesn’t require price improvement calculations on those orders.

Source: IEX Oct 11, 2018
IEX Does Price Improvement One Way…Their Own Way
What IEX is calling Price Improvement isn’t the same as what Reg NMS measures.
Their calculation is borrowed from academia, and reflects execution quality in a dealer market where the investor is always paying a spread to the dealer.
Here is how it works:
- When a passive order gets filled on the bid…the buyer spread saving is ignored. Instead, effective spread is calculated for the seller, who saved 0% of the spread.
- When a fill is received at mid, the buyer saves 50% of the spread.
- When a buyer crosses the whole spread, the buyer saves 0% of the spread.
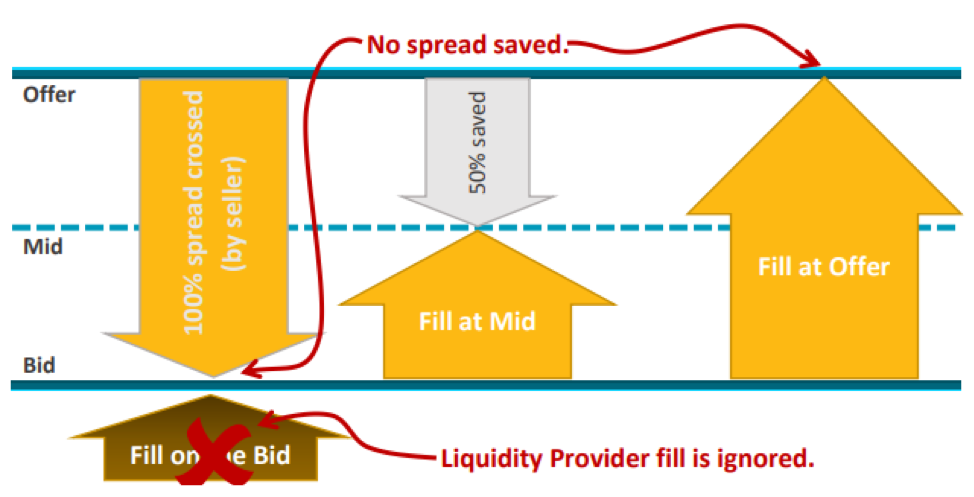
Source: Nasdaq Economic Research
How do Institutional Customers Really Trade?
Almost every institution uses sophisticated algorithms provided by their brokers to “work” orders during the day. These algorithms typically try to capture spread where possible, to minimize shortfall and reduce the spreads paid. That means they generally do the following three things:
- Often post on the bid…and wait…until they get a fill. When that happens the buyer saves 100% of the spread.
- Sometimes the algorithm will rest (hidden) at the midpoint. The buyer saves 50% of the spread (if they get a fill at all).
- If, after waiting for liquidity, the algorithm decides it needs a fill, it will typically cross the spread, “lifting the offer” for a buy order. The buyer saves 0% of the spread but on most exchanges has 100% certainty of a fill.
Visually, this is the amount of spread you save with each part of the routing strategy:
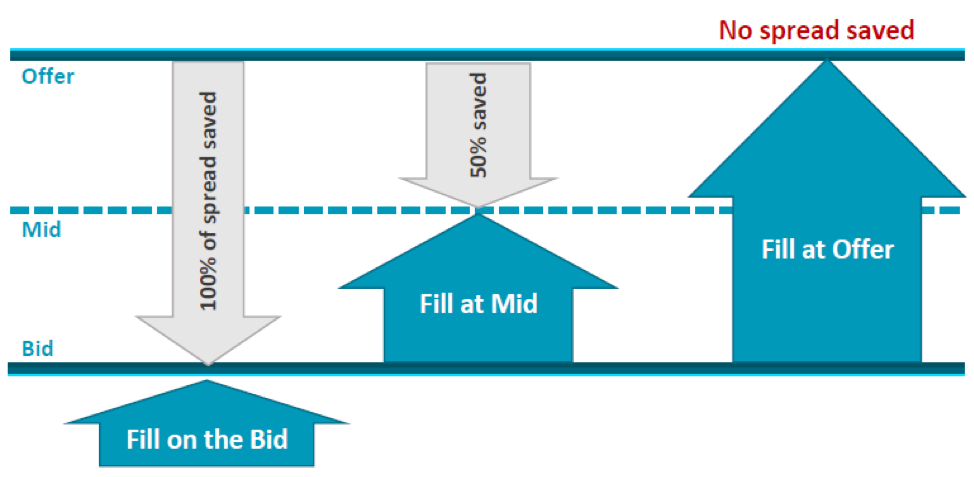
Source: Nasdaq Economic Research
Follow the Light (Not the Dark Markets)
The way IEX’s math works is to simply assume that no investor can do better than the mid-point.
We know that’s not true. Their blogs on investor queue priority show IEX does too.
We think markets should work differently – that the buyer and seller are both important – and that competitive lit quotes are good for our issuers, institutional investors, even retail trades that occur off exchange. We think lit quotes should count toward spread capture, and are worth incentivizing – for the benefit of all in the market – even those pegged to a mid-price. We also think it’s fair to share incentives with anyone willing to improve the NBBO.
It doesn’t seem fair to exclude all the fills of liquidity providers in a price improvement calculation. Sadly, this wouldn’t be the first time we’ve seen data selectively used to skewer the public debate.
The views and opinions expressed herein are the views and opinions of the author and do not necessarily reflect those of Nasdaq, Inc.
The views and opinions expressed herein are the views and opinions of the author and do not necessarily reflect those of Nasdaq, Inc.
Other Topics
Stocks Economy US Markets
Phil Mackintosh
Nasdaq
Phil Mackintosh is Chief Economist and a Senior Vice President at Nasdaq. His team is responsible for a variety of projects and initiatives in the U.S. and Europe to improve market structure, encourage capital formation and enhance trading efficiency.
Read Phil's Bio