By Frank Holmes, CEO and CIO, U.S. Global Investers
In the past three or four months, you may have noticed a plethora of headlines proclaiming the “death” of big U.S. cities such as New York, Chicago and Seattle. To paraphrase Mark Twain, these reports may be greatly exaggerated. However, there’s no denying that many urban city-dwellers—a great number of them high-income—are either relocating into the suburbs or strongly considering it, due to the double-whammy of the coronavirus and historic social unrest.
This latent “exodus,” as some are already calling it, may end up being among the biggest in U.S. history, or at least the biggest since the “white flight” of the 1950s and 60s. According to real estate brokerage firm Redfin, a record 27.4 percent of homebuyers sought to move out of their metro areas in the second quarter, with New York City, San Francisco, Los Angeles and Washington, D.C., seeing the highest net outflows.
The implications of this exodus will be felt not just by apartment tenants and city managers but also, potentially, municipal bond investors. The COVID-19 pandemic has led to an enormous loss of tax revenue for cities and states, and combined with the monumental cost of repairing damages sustained during summer-month riots, municipalities could be facing a $1 trillion budget shortfall. (I’ll have more to say on muni bonds later.)
Costliest Demonstrations in U.S. History
It’s now being estimated that the nationwide protests and riots that were sparked by the May 25 death of George Floyd in Minneapolis, Minnesota, may collectively be the costliest in U.S. history. According to Axios’ reporting of data compiled by Property Claim Services (PCS), the demonstrations across 20 states will cost the insurance industry between $1 billion and $2 billion. Adjusted for inflation, that may be an even greater cost than the demonstrations that took place in Los Angeles following the 1992 acquittal of police officers involved in the Rodney King case.
| Dates | Location | Dollars | 2020 Dollars | ||
|---|---|---|---|---|---|
| May 26 - June 8, 2020 | 20 States Across U.S. | $1-2B | $1-2B | ||
| Apr. 29 - May 4, 1992 | Los Angeles, CA | $775m | $1.42B | ||
| Aug. 11-17, 1965 | Los Angeles, CA | $44M | $357M | ||
| Jul. 23, 1967 | Detroit, MI | $42M | $322M | ||
| May 17-19, 1980 | Miami, Fl | $65M | $204M | ||
| Apr. 4-9, 1968 | Washington, DC | $24M | $179M | ||
| Jul. 13-14, 1977 | New York, NY | $28M | $118M | ||
| Jul. 12. 1967 | Newark, NJ | $15M | $115M | ||
| Apr. 6-9, 1968 | Baltimore, MD | $14M | $104M | ||
| Apr. 4-11, 1968 | Chicago, IL | $13M | $97M | ||
| Source: Axios, Property Claim Services (PCS), U.S. Global Investors | |||||
In Minneapolis and St. Paul, where this year’s riots began, as many as 1,500 businesses were heavily damaged, and demolition costs have skyrocketed so incredibly high that large sections of the Twin Cities are left with “scorched buildings and piles of rubble that will linger for months,” according to Minnesota’s Star Tribune.
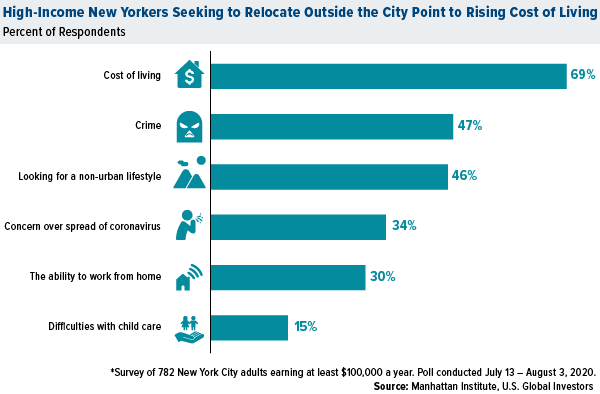
Violence and crime are top of mind among many people looking to move out of cities. The free-market think tank Manhattan Institute found that nearly half of high-income New Yorkers who were seeking to relocate cited crime as a contributing factor. At 47 percent, that was the number two reason for moving, number one being cost of living (69 percent).
The number of empty Manhattan apartments rose to a record 15,025 in August, up more than 166 percent from the same month in 2019, according to the Elliman Report. This brought the borough’s vacancy rate up to 5.1 percent, the highest in the report’s 14-year history. Movers in New York City are reportedly so busy right now, they’re having to turn people away.
Respondents to the Manhattan Institute’s survey aren’t overreacting over crime. Gun-related homicides across the U.S. are on track to be the worst since 1999. This past July was Chicago’s deadliest month in 28 years.
Money Flows Where It’s Respected Most
They aren’t overreacting over the rising cost of living either. Legislatures in certain cities and states have lately approved tax policies that are near guaranteed to drive many of the highest earners and businesses away.
Last week, New Jersey lawmakers agreed on a budget deal that will raise incomes taxes from 8.97 percent to 10.75 percent for tens of thousands of residents earning over $1 million.
Meanwhile, Seattle businesses, including Amazon, continue to urge the city council to repeal a payroll tax that is set to levy payrolls of those making at least $150,000 a year. The “Amazon tax,” as it’s called, is just one of many reasons why the retail giant is rumored to be considering moving operations elsewhere.
As I’ve often said, money flows where it’s respected most, and the survey above is proof positive of that.
Housing Market White Hot After Labor Day
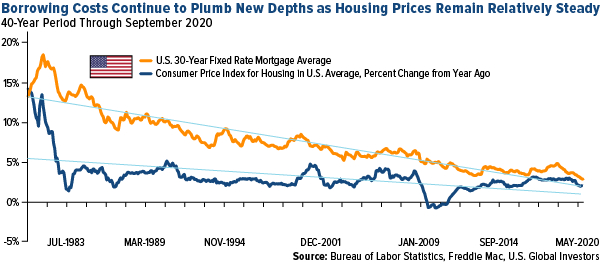
So where is the money flowing instead? Again, homes in the nation’s suburbs are seeing incredible demand right now, which is leading to an inventory shortage and pushing up home values. It doesn’t hurt that 30-year mortgage rates remain near record lows and, the past few months notwithstanding, prices have been rising relatively in line with consumer prices.
Median home sale prices climbed to $319,261 in the four weeks ended September 13, a 13 percent increase from the same period a year earlier. That’s the biggest such increase since October 2013, according to Redfin. Nearly half of all homes that went on the market had an accepted offer within the first two weeks, the highest level since 2012.
In the Hamptons, traditionally a weekend or summer destination for New Yorkers, new signed contracts for single-family homes more than doubled in August from a year ago.
We Practice Caution as Muni Investors
Back to municipal bonds. August was a challenging month for fixed-income markets, including the $3.9 trillion muni market. Although the Municipal Bond Index fell 0.47 percent in August, munis still outpaced both corporate bonds and Treasuries for the month.
It’s key that muni investors practice caution at this time. According to RBC Wealth Management, the pandemic “is beginning to pressure the ratings of many municipal issuers, and we expect this trend to continue through the remainder of” September.
So far, none of the major cities that have seen the most negative news coverage at this time—Seattle, Portland, Chicago, New York City—have seen their credit downgraded, but that could change.
For what it’s worth, we have no exposure to Seattle’s or Portland, Oregon’s debt, and given the current risks, I don’t see that changing in the near future.
Our YouTube channel is growing! We’ve been working hard to bring you timely and insightful videos on financial markets, including gold and precious metals, commodities, energy and more. If you haven’t already done so, follow the link below to subscribe to our YouTube Channel today!
SUBSCRIBE TO U.S. GLOBAL INVESTORS
All opinions expressed and data provided are subject to change without notice. Some of these opinions may not be appropriate to every investor. By clicking the link(s) above, you will be directed to a third-party website(s). U.S. Global Investors does not endorse all information supplied by this/these website(s) and is not responsible for its/their content.
The S&P Municipal Bond Index is a broad, market value-weighted index that seeks to measure the performance of the U.S. municipal bond market.
Holdings may change daily. Holdings are reported as of the most recent quarter-end. The following securities mentioned in the article were held by one or more accounts managed by U.S. Global Investors as of (06/30/2020): Amazon.com Inc.
The views and opinions expressed herein are the views and opinions of the author and do not necessarily reflect those of Nasdaq, Inc.


