The Nasdaq Q-50 Index: The Next Generation of Innovators
- By Mark Marex and Efram Slen, Nasdaq Global Information Services
The Nasdaq Q-50 Index tracks the performance of the 50 securities that are next eligible for inclusion into the Nasdaq-100 Index. The index deploys the proven methodology behind the time-tested Nasdaq-100 Index, with its emphasis on innovation and growth.
Methodology
The Nasdaq Q-50 (NXTQ) Index® tracks the performance of the 50 securities that are next eligible for inclusion into the Nasdaq-100 (NDX) Index®. The index begins with the universe of all companies, both domestic and foreign, that are listed on The Nasdaq Stock Market®. The index then removes all companies classified as financials from eligibility according to the Industry Classification Benchmark (ICB). Finally, the top 50 market cap names not currently in the Nasdaq-100 are included in the index. The methodology keeps the Nasdaq Q-50 Index aligned with the innovation and growth focus of the Nasdaq-100 Index, but with acute focus on the next generation of market leadership.
Performance
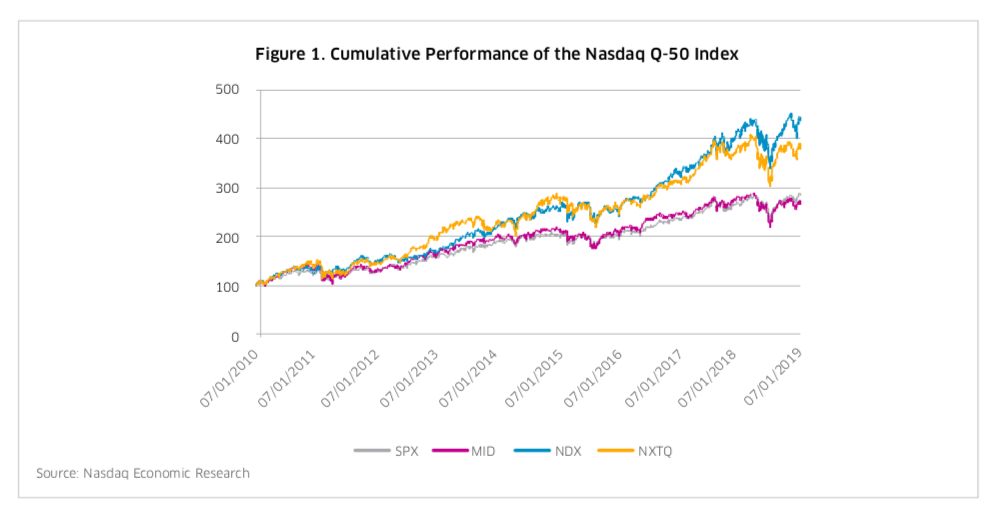
Figure 1 presents the cumulative performance of the Nasdaq Q-50 Index, alongside the Nasdaq-100 Index and the S&P 500 (SPX) / S&P Midcap 400 (MID) Indexes, for the period from June 30, 2010 to June 30, 2019.
During that 9 year period, the Nasdaq Q-50 outperformed the S&P 500 by 104% on a price basis, and its midcap cousin, the S&P Midcap 400, by 116%. While the Nasdaq Q-50’s price performance trailed the Nasdaq-100 over this period by 52%, the key benefit of the Nasdaq Q-50 is diversification into additional disruptive companies beyond the established, mega cap and large cap leaders in the Nasdaq-100.

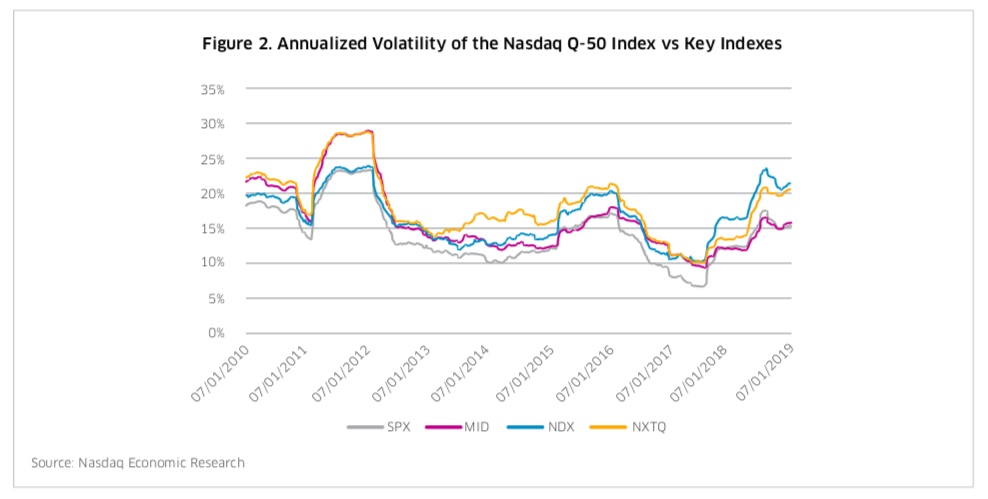
Figure 2 shows a tendency for slightly elevated volatility for the Nasdaq Q-50 vs the Nasdaq-100 as well as the S&P 500/ S&P Midcap 400, which is corroborated when we look at average annualized volatility over this period of 18.1% vs 16.7% and 14.2/16.2%, respectively.
One explanation is the smaller number of constituents and resulting higher concentration of the index: with only 50 members (vs. 100 or 500/400), the Q-50 is more sensitive to the price swings of each name. Further, this elevated volatility fits the profile of up-and-coming disruptors who are likely still early in the growth stage of their business life cycle; on average, firms in the Nasdaq Q-50 went public 18 years ago, vs. 26 years ago for the Nasdaq-100. In comparison to the S&P Midcap 400 index, the approximately 200 bps of annual increased risk of the Q50 was more than compensated for by an annualized return of 16.3%, vs only 11.8% for the S&P Midcap 400.

Exposure
Figure 3 displays the market capitalization of each index as of June 30, 2019. We present three different variations of the market capitalization calculation (position-weighted, average, and median), to help illuminate the intense skew that can arise in the position-weighted calculation.
As you can see, the Nasdaq Q-50 indeed has a significantly lower market cap tilt than the Nasdaq-100, to some degree expected by virtue of the index filtering for the next 50 largest market cap companies outside of the 100 that define the Nasdaq-100. We also observe a significant tilt towards lower market caps as compared to the S&P 500, while still maintaining approximately three times the levels of the S&P Midcap 400. This tilt towards smaller, up-and-coming companies that have nonetheless broken into the ranks of large caps, is a key ingredient to the index’s angle towards the next generation of innovators.

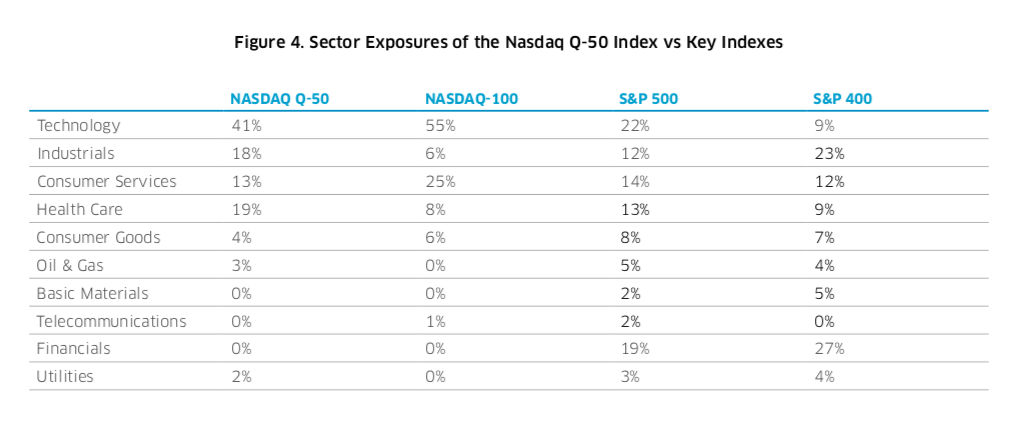
Figure 4 displays the sector exposure of each index as of June 30, 2019. As you can see, the Nasdaq Q-50 continues to carry the Tech torch from its older sibling, the Nasdaq-100. But, the Nasdaq Q-50 is lighter by 14% in Technology. In addition, the Nasdaq Q-50 is 12% lighter in Consumer Services. These underweights relative to the Nasdaq-100 translate into overweights within Industrials and Health Care. These marked differences in market cap and sector exposures between the Nasdaq-100 and Nasdaq Q-50 can make for a compelling case for diversification between the two.

Liquidity
Figure 5 illustrates the liquidity characteristics of the securities in each index as measured by turnover, which is the average daily dollar trading volume (trailing 6 month) for an index divided by its average market capitalization, as of June 30, 2019. Although the Nasdaq Q-50 Index is skewed towards the lower end of the capitalization spectrum, the index touts greater constituent liquidity than both the Nasdaq-100 and the S&P 500.

View NXTQ Index Performance Data >
Nasdaq® is a registered trademark of Nasdaq, Inc. The information contained above is provided for informational and educational purposes only, and nothing contained herein should be construed as investment advice, either on behalf of a particular security or an overall investment strategy. Neither Nasdaq,
Inc. nor any of its affiliates makes any recommendation to buy or sell any security or any representation about the financial condition of any company. Statements regarding Nasdaq-listed companies or Nasdaq proprietary indexes are not guarantees of future performance. Actual results may differ materially from those expressed or implied. Past performance is not indicative of future results. Investors should undertake their own due diligence and carefully evaluate companies before investing. ADVICE FROM A SECURITIES PROFESSIONAL IS STRONGLY ADVISED.
© Copyright 2019. All rights reserved. Nasdaq, Inc. 1883-Q19
