The Longest Record Broken: Gold/Silver Ratio Hits Highest in Over 5,000 Years

Another day, another disaster. We’re getting used to record-breaking moves nowadays. This is the fastest the stock market has ever gone from a peak to a bear market. The Dow Jones Industrial Average fell 12.93% Monday, beating the worst day in 1929 (-12.82%). Etc., etc.
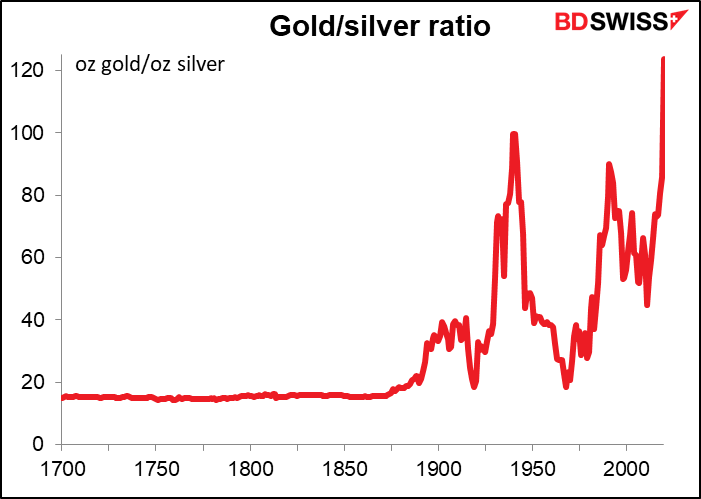
The most amazing record broken was not in the stock market, however. It was the long-standing record in what’s perhaps the longest-running price series in financial history: the gold/silver ratio (i.e. the price of one ounce of gold in terms of ounces of silver). Monday’s market sent that price to a record high – the highest level in over 5,000 years.
We have data for this series going back a long, long time – during Pharaoh Menes’ time (circa 3100 BCE) for example the ratio was 2½x, whereas in King Hammurabi’s day (circa 1750 BCE) it was 6x. The legendary Greek king Croesus (circa 560 BCE), who supposedly invented gold and silver coins, was more of a gold bug – he used a 13.33x ratio. Emperor Constantine I (280-337 CE) was less so at 10.5x.1
We have more frequent data starting from 1687 (courtesy of www.measuringworth.com2) that confirms it: yesterday the gold/silver ratio was the highest ever. The ratio peaked at 123.78. During Asian trading today it dropped back to around 116-117, but once London came in it went shooting back up to the 120-121 range. For reference, on Friday it averaged 101.74, and during all of 2019 it averaged 86.04. This is an amazingly swift change in this price. (The previous high before this month was in 1940, when it averaged 99.76 for the year.)

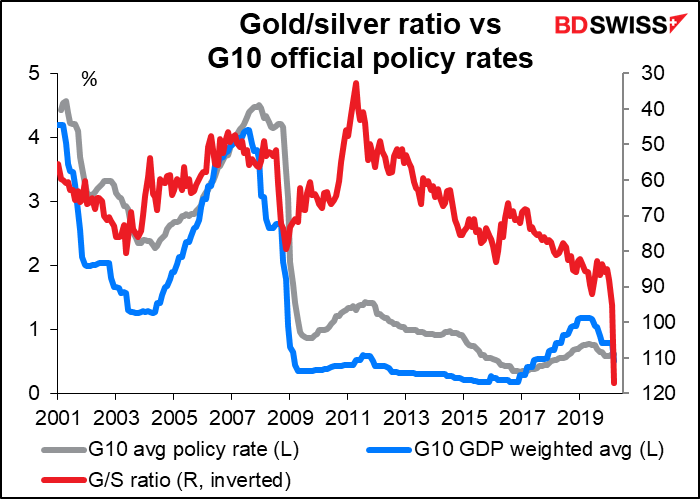
It’s not clear (to me at least) exactly what drives this ratio. The best correlation I could find was with the 10-year US breakeven inflation rate. But contrary to what one might think, the ratio tends to go up – that is, gold outperforms – when inflation expectations are lower. I thought gold was supposed to be a hedge against inflation? Perhaps this is just the experience of the last 20 years, when inflation hasn’t been much of a problem. In that case, lower expected inflation would mean a) central banks cut their policy rates, and lower interest rates tend to boost the gold price, and b) lower expected inflation probably stems from lower expected economic activity, which might imply less industrial demand for silver – although I must admit I couldn’t find a clear link between industrial activity and the price of silver.

It does appear that before the Global Financial Crisis at least, global interest rates played a part in determining this ratio, as one might expect, since gold tends to rally during periods of lower interest rates. But afterward ... not really.

There’s some evidence that the ratio goes up before and during recessions, but it also goes up during times of a healthy economy too, so this is not definitive.

Citibank found that for the period 1Q 2011 to 1Q 2019, “only changes in the yen, excess reserves, and inflation expectations had a statistically significant (p = 0.05) impact on the price ratio of gold-silver.”
In short, I can’t say exactly what has driven this ratio to the highest level in some 5,120 years, but it does prove one thing beyond a doubt: the financial markets are in an extraordinary, unprecedented situation.
One view of the ratio, by Wheaton Precious Metals1, is that the ratio is “an indicator of the global monetary condition.” According to their analysis, “during periods of inflationary monetary proliferation, the ratio falls. During eras of deflationary monetary destruction, the ratio rises. To put it plainly, these highs are alerting us to a pervasive capital shortage.” That agrees with what I found, that the ratio tends to rise when inflation expectations fall. It would also explain why this historical high coincides with the most powerful coordinated central bank injection of funds since the Global Financial Crisis, and indeed perhaps ever.It would also go along with the widening currency basis and the Fed’s move to make currency swaps more available. Perhaps the 5,000-year high in this indicator is warning us of a tremendous deflationary period ahead.
One other point that may be connected. I’m not sure how accurately the price of gold that I see on my screen reflects the actual demand. The gold market seems split at the moment: while the price is falling, meaning there are more sellers than buyers, everything I read on Twitter is that physical gold is nearly unobtainable – many banks and refiners have run out of inventory. Apparently there has been a surge in retail demand for gold coins and bars at the same time as the price has been falling. It seems that the “paper” market, the futures and ETFs, is determining the price and does not reflect the heightened demand on the street for hard metal during this time of insecurity. In that case, gold prices could be even higher and the ratio even higher than what we see.
Given how exceptional the current ratio is for the extraordinarily long data series that we have, does this mean silver is a good bet to appreciate vs gold now? Over the longer term, I would think so. A ratio like this cries out for mean reversion. But remember: markets can remain irrational longer than you can remain solvent. I make no claim to understanding exactly why this ratio has hit a 5,000-year high. In these volatile times, I’d be reluctant to put on a trade in a market that I don’t understand simply because the levels seem extreme.
1 Wheaton Precious Metals, “Not Random: The Gold-Silver Ratio,” available on the web at https://s21.q4cdn.com/266470217/files/doc_downloads/blog_post/02/2020-01-Jan-Macro-Metal-News-(web2).pdf
2Lawrence H. Officer and Samuel H. Williamson, "The Price of Gold, 1257-Present," MeasuringWorth, 2020 URL: http://www.measuringworth.com/gold/
The views and opinions expressed herein are the views and opinions of the author and do not necessarily reflect those of Nasdaq, Inc.