The United States Federal Reserve or “Fed” has a “dual mandate.” In short, its goal is maximum employment and price stability. The transmission mechanism is monetary policy. In its own words, “monetary policy works by spurring or restraining growth of overall demand for goods and services in the economy. The Federal Open Market Committee (FOMC) can help stabilize the economy in the face of these developments by stimulating overall demand through an easing of monetary policy that lowers interest rates. Conversely, when overall demand for goods and services is too strong, unemployment can fall to unsustainably low levels and keep inflation in check by tightening monetary policy to raise interest rates.”

Since March of 2022, the FOMC has been tightening monetary policy by increasing the Fed Funds rate. The current odds of further rate hikes by the end of the calendar year stand at 44%. The probability declined dramatically following the JOLTS and Consumer Confidence data released on August 29.
The Data
JOLTS is shorthand for Job Openings and Labor Turnover Summary. The data is collected and made public by the U.S. Bureau of Labor Statistics. The most recent information shows that fewer people are quitting their jobs and less new jobs are being advertised. Essentially, the labor market is starting to respond to higher rates. The FOMC transmission is becoming effective.
Consumer confidence, which tends to be highly correlated with labor markets, also declined in the latest report. This data includes current and expected measures, and many consider it a “leading economic indicator.”
On a very basic level, consumers are typically more confident about the economic outlook when their jobs feel secure, or they believe they could easily take a position that paid as well if not more. It takes many months on average for the impact of rate changes to be felt more broadly. We’re coming up on 18 months since the Fed began tightening monetary policy. If history is a guide, these trends could be expected to continue.
What About “Expected” Volatility?
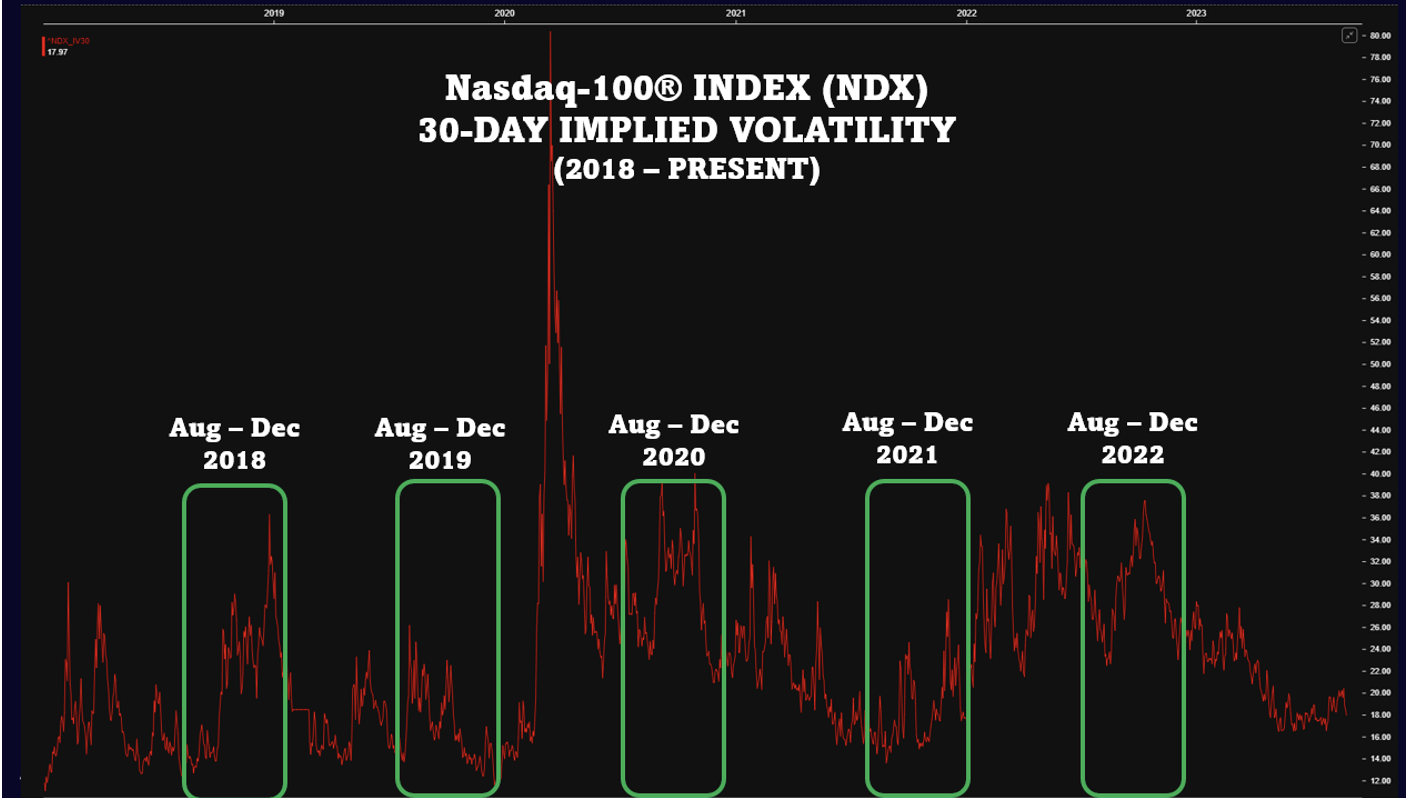
The chart below shows the Nasdaq-100® Index (NDX) implied volatility for at-the-money (ATM) options since 2018. Options expire at some point in the future, so the price of any option has an implicit or implied volatility based on expectations.
In theory, if you bought an NDX option with an implied volatility of 17.5% (annualized) and the index subsequently realized a volatility of 24.5% over the life of the option, assuming the position was dynamically delta hedged, there should be a profit. On the flip side, if you bought 17.5% volatility, hedged regularly and the NDX realized only 15% volatility between purchase and expiration, you would expect to lose money.
In reality, most individual traders consider implied volatility in their option trading, but their positions tend to have more of a directional exposure because they don’t hedge as frequently (if at all) their delta. The business model for an options dealer (market maker/bank/liquidity provider) is quite distinct. As such, they look to minimize directional exposure and spread off the inherent volatility risk.
For example, dispersion trading has grown considerably over the past decade. Basically, an institutional options user manages a position that tends to be short index volatility (units/options) and long volatility (options) in the top constituent holdings for that index. This exposure is vega-weighted appropriately and it tends to add liquidity throughout the ecosystem.

August to December Volatility
Looking again at the five-year history of NDX 30-day ATM implied volatility, the tendency is for volatility to increase between August and December. However, there are clearly situations where things run counter to a historical trend. For example, implied volatility consistently moved lower into year end for 2019.
In 2020 and 2022, there were volatility swells during the autumn months (election years) that subsided in November and December. In 2018 and 2021, forward volatility measures mostly moved higher during the last few months of the year.
There are few guarantees in life (death and taxes) and none in capital markets. Much of the day-to-day options flow that occurs in Apple, Microsoft, Amazon, NVIDIA, Meta, Alphabet, Tesla and elsewhere is ultimately managed at the index level.
Perhaps it’s no surprise to see NDX average daily volumes continue to set multi year highs as August comes to a close. The index reflects an economy that by most measures remains strong. It indicates the growth of technology in our lives and across other sectors. The NDX is arguably the benchmark for the 21st century.
The Nasdaq-100 Index Options (NDX) allow end users to mold their exposure based on their specific needs and over a wide variety of time horizons. There are multiple sizes with the Nasdaq-100 Micro Index Options (XND) representing a smaller notional tool that makes the potential benefits of index options to a much broader audience.
Onward.
Nasdaq® is a registered trademark of Nasdaq, Inc. The information contained above is provided for informational and educational purposes only, and nothing contained herein should be construed as investment advice, either on behalf of a particular security or an overall investment strategy. Neither Nasdaq, Inc. nor any of its affiliates makes any recommendation to buy or sell any security or any representation about the financial condition of any company. Statements regarding Nasdaq-listed companies or Nasdaq proprietary indexes are not guarantees of future performance. Actual results may differ materially from those expressed or implied. Past performance is not indicative of future results. Investors should undertake their own due diligence and carefully evaluate companies before investing. ADVICE FROM A SECURITIES PROFESSIONAL IS STRONGLY ADVISED.
© 2022. Nasdaq, Inc. All Rights Reserved.
The views and opinions expressed herein are the views and opinions of the author and do not necessarily reflect those of Nasdaq, Inc.

