
The 2023 Intern’s Guide to Trading
We recently updated our Intern’s Guide to the Market Structure Galaxy. Today we graduate to discussing how trading works.
What is a quote?
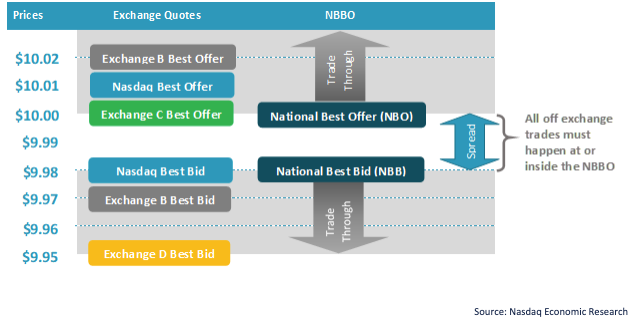
In our guide to market structure, we talked about how all stocks have quotes at different prices across around 16 different exchanges.
- A bid represents a price that a buyer is willing to pay to buy.
- An offer represents a price that a seller is willing to receive to sell a stock.
- The difference between the two prices is called the spread.
All the bids and offers are quotes, prices where trades could happen, but are not yet trades.
There is also a centralized processor (called a SIP) that pulls all of these electronic bids and offers together to show a National Best Bid and Offer (NBBO).
Today, that is our starting point for how all orders trade.
Chart 1: Bids and offers come from all the exchanges for each security; a centralized processer (SIP) creates the NBBO
What is an order?
Orders are the full instructions that a trader sends. It will include the ticker (stock), side, size (number of shares) and price.
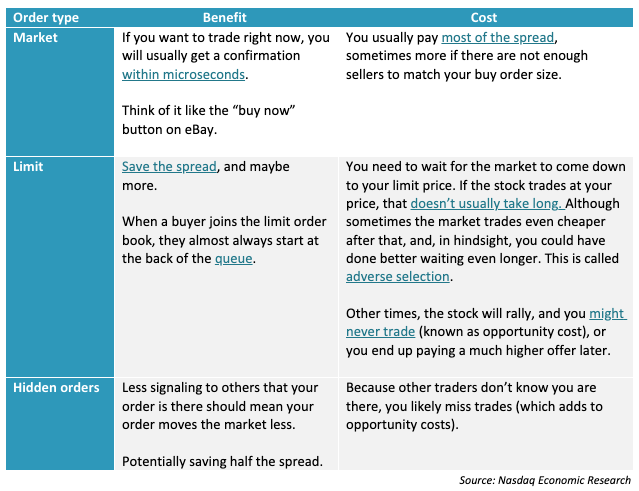
A buyer doesn’t always have to wait to buy at the bid. If they want to trade faster, they will pay the seller the offer price (and vice versa for selling). If you use a “market” order, you are effectively saying “you want to buy now at whatever the best offer price is.”
There are other, more complicated, order types, including hidden orders at the midpoint between the bid and the offer to others that fade (automatically change their limit to avoid trading), as sellers arrive at the market to avoid adverse selection.
Table 1: Traders’ choices and costs
1 Time is Relativity: What Physics Has to Say About Market Infrastructure
2 Lit Markets Provide Price Improvement Too
3 What Markouts Are and Why They Don't Always Matter
4 Large Queues are a Small-Cap Problem
5 Are Large Queues a Big Problem?
6 What Markouts Are and Why They Don't Always Matter
7 Routing 101: Identifying the Cost of Routing Decisions
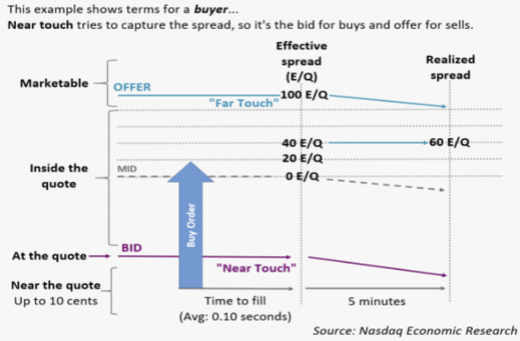
In the diagram below, you can see how all of these order types behave over time, and the different costs of each (spread, adverse selection and opportunity costs).
You see market orders (green) crossing the spread but executing immediately, while limit orders (blue) need to wait until someone else crosses the spread to sell. While mid-point orders (yellow line) can save half a spread if they fill, they can also miss trades (because they are hidden) and over time prices can even move away (resulting in a trade that costs more than a market order would have cost initially, something that is called opportunity cost).
Chart 2: Buyers’ choices and consequences
chart
Where do stocks trade?
Speaking of how orders route through the market, remember that we talked about how you can trade most U.S. stocks in many venues? That actually includes:
- Sixteen different exchanges, regardless of where a stock is “officially listed.”
- Over 30 ATSs (dark pools),
- As well as bilaterally with a number of wholesalers or proprietary firms (single dealer platforms or SDPs).
Even for mutual funds, Reg NMS protects investors by ensuring that orders are sent (routed) to other venues if they can’t be executed at prices as good as the public NBBO. Although there is one important difference — dark pools and exchanges can only trade in whole (1-cent) ticks – while proprietary traders can (still, for now) fill market orders at any price.
How retail and institutional orders are routed into the market works very differently. Even the brokers that handle the orders are mostly different. Institutional brokers are experts in building algorithms to work large mutual fund orders, while retail orders are usually filled immediately by market makers, usually off-exchange.
That actually means that a mutual fund is unlikely to trade directly with most retail orders, which results in something called “internalization.” You see that in Chart 3, where a large proportion of all trading occurs separately, in the top two circles, before orders are sent to exchanges to trade. In fact, the data suggests over 40% of all shares are executed off-exchange.
Chart 3: Where stocks trade

Even the data in these pie charts come from a variety of sources.
- Exchanges all send their trades to the SIP, with attribution about which exchange did the trade.
- All of the other trades, though, are considered “off-exchange” and print to the tape anonymously via one of two Trade Reporting Facility (TRFs).
- However, FINRA reports aggregated flows that show trades for each trading venue and ticker on a delayed basis (which allows us to show the market share of off-exchange in the charts above too).
Who is trading?
Much but not all trading is done by investors. In fact, we have estimated that market makers and arbitrageurs are likely more than half of all trading in the market.
Arbitrageurs need to almost instantly buy and sell mispriced assets. Their trades are critical to keeping market prices efficient, which ultimately reduces frictions paid by longer-term investors. For example, they keep Futures and ETF prices in line with underlying stock prices, they can hedge options trades cheaply, and they can also make sure stocks in a sector move roughly the same way, based on the same news.
How do retail investors trade?
There are two main types of long-term investors, retail investors and mutual & pension fund (or institutional) investors. There are big differences in how retail and institutional investors trade.
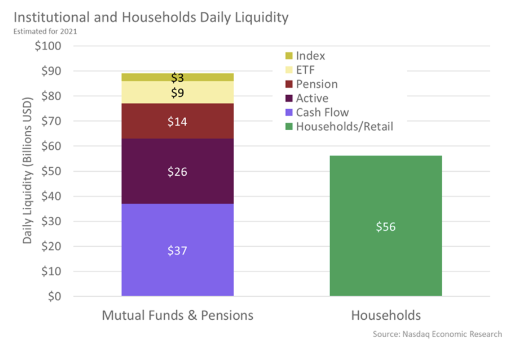
Chart 4: How much do retail and mutual funds trade?
Data suggests that the average retail trade is small – less than $10,000. That fact is important because usually the offer size is much larger than the size of a retail investor’s bid.
That means retail market orders should be able to trade instantly without any residual market impact. For retail investors, it means their trades should rarely cost more than the spread to complete.
Retail buying and selling are also usually pretty random, something academics call “less informed.” That makes it easier for market makers to capture spread (or avoid adverse selection) trading with just retail.
As a consequence, the market has evolved to service retail traders very differently than everyone else, with most orders first sent to off-exchange market makers (also called wholesalers, Chart 6), where retail investors frequently get fills at prices better than the NBBO—called price improvement—which occurs in increments as small as 1/100ths of a cent.
In case retail traders don’t fully understand how the markets actually work, there are rules in Reg NMS to protect them from bad prices, even though their orders don’t trade on exchange. NMS Rule 606 tracks all the payments for order flow (PFOF) paid, and NMS Rule 605 keeps track of all the trades executed worse than the NBBO, as well as all the price improvement wholesalers pay.
Chart 5: Rules to keep track of retail execution quality
How do mutual funds trade?
Mutual funds and pension funds (so-called “institutional” traders) pool the funds of sometimes thousands of investors. That means their portfolios, and also their trades, are usually much larger.
As a result, their orders also take much longer to complete. If the average size of the offer is just $10,000, a $1 million trade might need to be broken into 100 separate orders.
Each one of these separate orders is also more likely to benefit more from those special order types we talked about above – as they help a large order be traded for the lowest cost possible. There are several ways institutions can do this, often in combination:
- Working orders: Brokers will usually “work” orders for mutual funds over a number of minutes or hours. That means they split larger “parent” orders up into smaller (child order) pieces. That way, each child has a smaller impact on supply and demand and, therefore, price.
- Hiding: Others in the market are always looking for signs that a stock will rally or fall (to save themselves money trading). Posting orders in dark pools or using hidden order types on exchange allows investors to be in the market without advertising they are there.
- Smartly Routing: Different stocks have wider spreads, longer queues and more depth, and some venues have different trading costs too. An algo and smart router can choose different paths and prices for each child order throughout the day to improve the price and speed of trading.
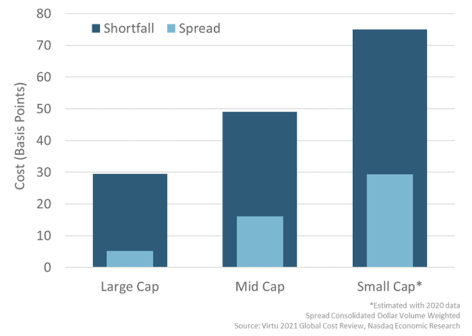
Even though spreads seem very small, trading costs are important to manage, especially because worked orders usually start to have a market impact over time (where a buyer increases the prices of the stocks through trading, and the market stays at those new prices).
We estimate that mutual and pension funds trade around $90 billion each day, which includes a lot of cashflows (Chart 4). That adds to around $23 trillion over a year.
Even though average trade costs are reported at just 0.31%, that adds to around $70 billion each year in trading costs. So, minimizing costs can save investors a lot of money.
Chart 6: It costs more than spread to finish most institutional orders, and smaller stocks cost more than larger stocks thanks to different levels of liquidity and trading
Where do the best prices come from?
All exchanges produce prices (bids and offers). But only exchanges produce prices. All other venues use the prices set on exchanges to determine their own trading prices.
Even still, you might wonder why we need so many exchanges.
One thing that differentiates some of the exchanges is the different trading fees and costs. That’s because they are focused on solving different problems.
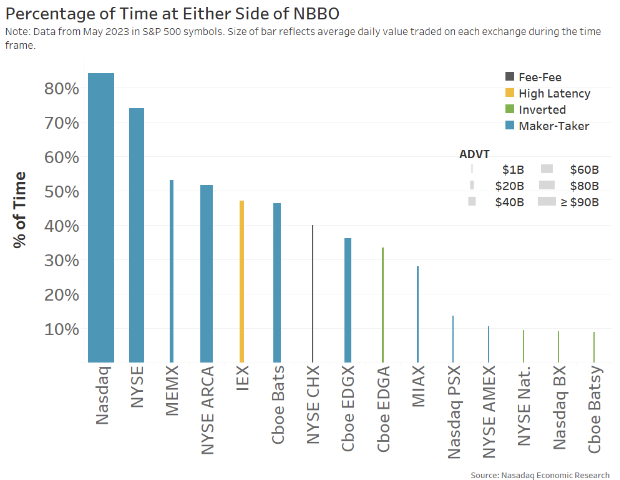
So-called “inverted exchanges” charge traders looking to capture spread (liquidity providers) and pay a rebate to liquidity takers. That makes it economically cheaper for a spread-crossing order to trade at inverted venues, thus attracting spread crossing orders to those markets first. In short, you can “pay” for queue priority. However, charging liquidity providers more for their limit orders reduces the returns on spread capture. Consequently, it often results in one-sided markets (and wider spreads on that venue).
Speed-bump markets also attract market makers and more patient orders. Because they can cancel offers before a buyer can cross their spreads, those trying to capture spreads have fewer adverse selection trades. That can make it more profitable, especially for market makers, which also allows those exchanges to charge higher fees on their trades.
But for most investors, including those trading off-exchange, tight spreads and a competitive NBBO are important for reducing their costs. Tight spreads also help reduce the costs of capital for issuers. In that sense, tight spreads create important positive “externalities” for lots of other market users – including some who trade very little on exchange.
In studies we’ve done in the past, data shows that it’s hard to attract competitive bids and offers to both sides of all 8,000-plus stocks in the U.S. market. However, data clearly shows that exchanges offering rebates to liquidity providers, even though they add to just a fraction of a cent (around 0.3 cents typically), make a big difference to quoting activity. In fact, the tightest spreads, and most real liquidity, almost exclusively come from rebate-paying (so-called maker-taker) markets.
Chart 7: Rebate markets have, by far, the most competitive quotes and also offer the most liquidity
Bids and offers are mostly prices that everyone can trade at (speed bump markets are an exception). But because they are available for all to see on the SIP, they also signal the existence of buyers and sellers to the whole market.
Hidden orders create a way to work an order without the SIP broadcasting its existence.
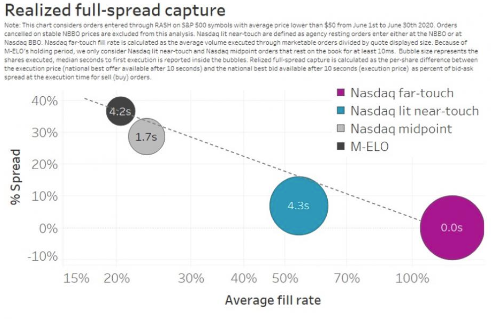
Our research shows hidden orders capture more of the spread even than lit orders if we look at the market after the fill has occurred (Chart 8). However, the cost is a much lower chance of execution because other traders don’t know you are there.
The same research shows how bids (for a buyer) often don’t capture much spread if you look after the trade. That’s another reason why rebates are important to reward liquidity providers for producing tight spreads for all traders – as rebates help make liquidity provision competitive with other trading styles.
Although for an institutional buyer, capturing the whole spread, only to see the stock get cheaper for your next child order, can be a good thing. It’s why adverse selection isn’t always bad.
Chart 8: Markets price the cost of waiting, using different order types very efficiently
How fast should you trade?
Which brings us to an important question: If working orders more slowly saves money, but waiting creates opportunity costs (or “alpha decay”), how fast should you trade?
In reality, the optimal trading speed depends a lot on what you and other investors know.
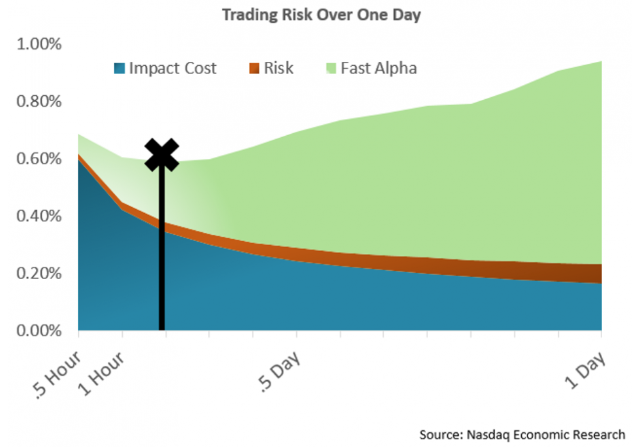
Market impact: This is created when you add more demand to the market. Supply isn’t adequate, and so prices rise to attract more sellers. Higher prices as you trade mean you keep less of the later outperformance of the stock while you hold it.
Opportunity cost: On the other hand, if you reduce the amount of demand you add the price might still rise if others also like the stock and are buying too. Then, the price you pay later might still be higher – something traders call opportunity cost.
There is a mathematical way to optimize this problem which we discussed in How Fast Should You Trade? This shows that you need to understand the trading trade-offs:
- Alpha in the trade. For a portfolio manager, alpha is good, as it represents the amount a stock outperforms the market. But trading alpha measures how fast the stock goes up when you want to buy it, even if you don’t trade – so it’s an opportunity cost.
- Trade size reflects how much your order changes the normal supply and demand.
- Liquidity in the stock determines the minimum time a trade size should take to finish. Smaller cap stocks typically have less liquidity, which limits how fast you can build a large holding in those stocks.
- Spread costs add up. Generally, the wider the spread, the more expensive a trade will be (Chart 5). That’s because investors typically need to cross more spreads than they can capture.
Once you know all this, you can estimate how trading costs, opportunity costs and risk change over time and minimize your trading costs by weighing the alpha (opportunity costs) against the market impact (cost) of trading faster.
Chart 9: Optimal speed to trade-off impact and opportunity cost can be mathematically determined
People trade at different speeds throughout the day
Complicating the problem above is the fact that there is almost always more trading in the morning and afternoon – and less around lunchtime. It’s known as a VWAP curve, or smile.
Other things also change during the day – spreads and price volatility typically fall as the day goes on, making it cheaper to trade with all the liquidity at the end of the day – provided the stock hasn’t already moved on you.
The close is usually the most liquid part of the day. The open and close also work differently to trading during the day. Rather than a bid and an offer creating spread costs, the market open and close are auctions. In these auctions, buyers and sellers add orders, and the “clearing” price is found – where supply equals demand – literally a single price where buy shares equal sell shares.
Chart 10: Trading speeds change over the day
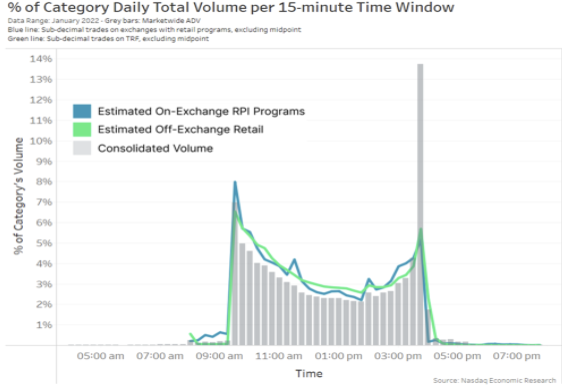
On specific days in the year, when index funds all need to trade, or futures or options expire, closes are even larger.
Don’t stress — computers do most of the trading for investors
Although this all sounds complicated, the reality is that computers (trading algorithms and market maker models) do most of the trading these days, and they can be optimized with data and programmed to fix much of the complexity that human traders face. Some likely even incorporate machine learning and artificial intelligence.
It’s also important to remember that most of the market is also interconnected and automated. The SIP and NMS rules require it.
So, the biggest input required from investors is to decide what stocks they want to buy, tell the algorithm how fast they need to trade, and sit back and watch as fills come in.
