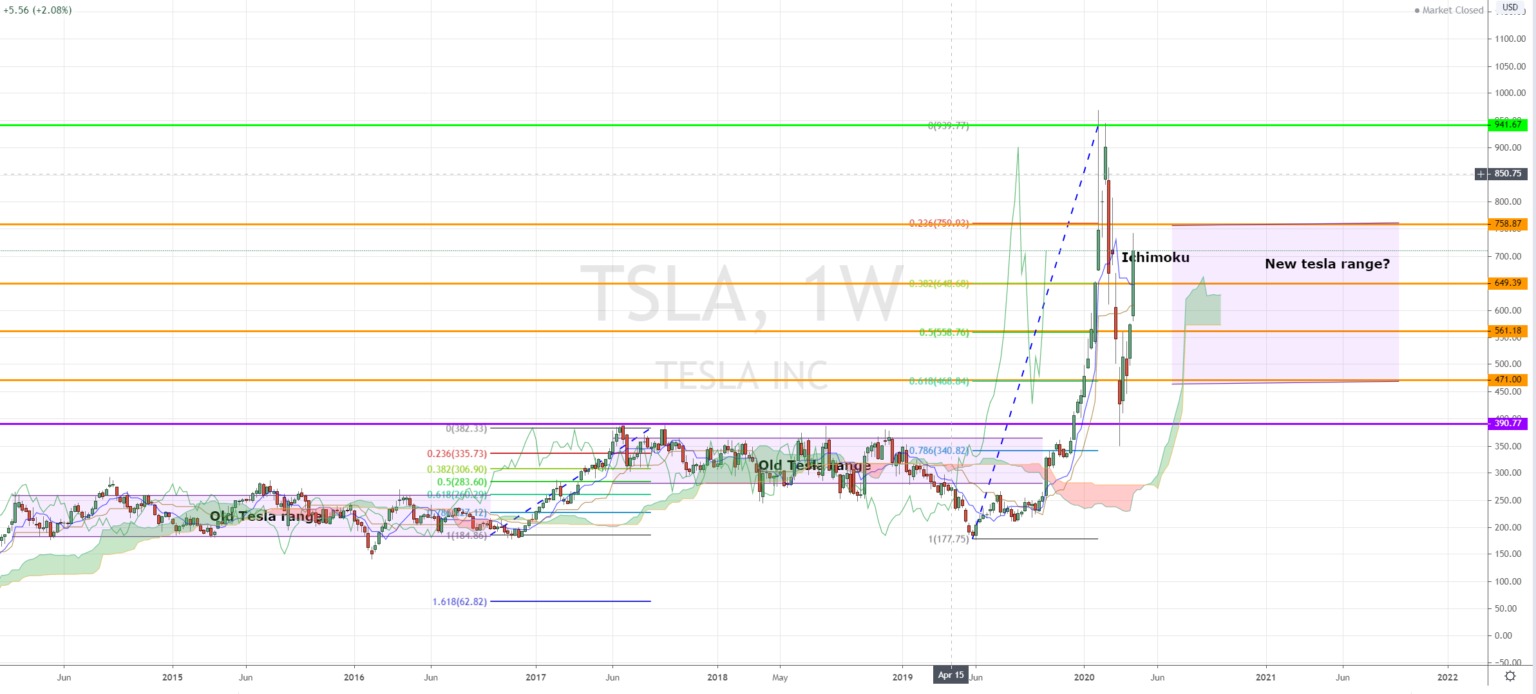
Tesla Stock Price Analysis: On March 17, 2020, I did an analysis on the Tesla stock price based on my Invest Diva Diamond Analysis, or the IDDA. After its stock price crashed that brought down the price to $390, I forecasted that based on my system, the price could go back up to around $758. Now today, it is April 14, and we are almost there and it could even go higher by May 2020.
New to investing? Start off the right way >>
Tesla Stock Price Analysis – Fundamentals
The reason why I wanted to cover Tesla stock outlook, again, is because I actually got quite a lot of backlash on that analysis. Many people in the comments said there is no way Tesla is going to go back up. So I wanted to actually take this opportunity and say, first of all, I’m not saying that I’m Nostradamus. However, my system has repeatedly given me price points that have worked out not only with Tesla shares but also with over 50 other assets in my portfolio that I cover every single week with our premium investing group members. Tesla is one of the stocks that I have been sharing publicly and discussing my analysis.
I 100% standby my system the Invest Diva Diamond Analysis that covers the market analyzes any asset not only stocks, but also forex and cryptocurrencies from five different points, fundamentals, technicals market sentiment, and it fits in with your unique risk tolerance. Tesla happens to be suitable for those with medium to high-risk tolerance. That’s because it is a little bit more of a medium-term investment. In this video, I cover my Tesla stock price predictions for May 2020 and onward.
Tesla Stock Price Analysis – Technicals
The Tesla stock price tends to fall into a range and after it reached these lows, which was $390, which was the exact price point that I had created as a support level is because it was it used to be the resistance level In the past, it was a top of the range for the Tesla stock for the longest time since July of 2017 until August of 2019.

This article was originally published on InvestDiva.com.
The views and opinions expressed herein are the views and opinions of the author and do not necessarily reflect those of Nasdaq, Inc.