
Paul Tudor Jones Uses 29’ Precedent to Predict 87’ Crash
As the adage goes, “History doesn’t always repeat, but it does tend to rhyme.” Legendary investor Paul Tudor Jones, founder of Tudor Investment Corporation, made a career of that simple saying and some timeless investing principles. In 1980, Jones started his investment firm. At the time, Jones was an obscure trader who started his investing operation on a shoestring budget of a mere $30,000 outside investment.
However, by 1987, Jones kick-started his legendary career with a windfall trade shorting the stock market into one of the worst single-day declines in history. How did Jones predict the October 19th, 1987 “Black Monday” crash, which saw the S&P 500 plunge some 20% in a single session?
· Historical Precedent: Jones, a keen student of market history,recognized excessive market speculation and overvaluation.
· Technical Analysis: Jones and his partner at the time used an overlay chart, the 200-day moving average, and “Elliott Wave Theory” (identifies recurring wave patterns) to predict the crash.
The simple yet effective contrarian process helped him make ~$100 million and start his path to his current net worth of ~$8 billion. As I have learned from mentors and my own trading, precedents can be also be used for individual stocks.
Tesla March 2020 Precedent
Over the years, Tesla (TSLA) has become one of my favorite stocks to trade. The stock has a unique character: It tends to rise over time, but is also very volatile. Short-term volatility in long-term uptrends equates to opportunity for savvy investors.
While looking at Tesla’s current chart recently, I immediately got a flashback that reminded me of March 2020. At the time, the market was uncertain due to COVID-19. Meanwhile, Tesla shares had these characteristics:
1. A strong uptrend ending in a climactic/gap move.
2. Three waves of selling resulting in ~50% decline in a short time.
3. Seven straight red sessions before a tap of the 200-day moving average.
Below is the 2020 chart:
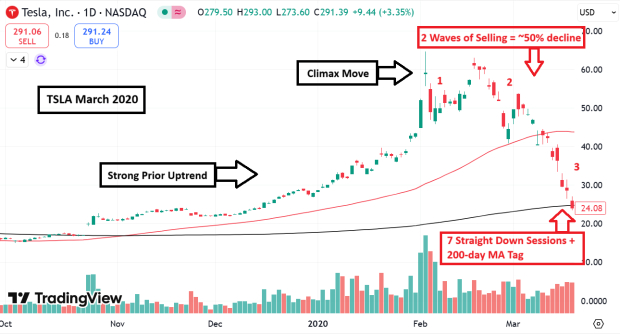
Image Source: TradingView
Below is the current TSLA chart for comparison:
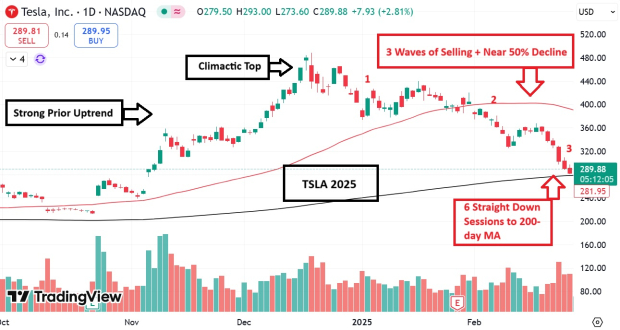
Image Source: Zacks Investment Research
Tesla Enters “Value Zone”
The 2020 to current-day comparisons don’t end at the technical chart for TSLA. Another striking similarity was in Tesla’s valuation. In 2020, TSLA’s price-to-sales ratio was single digits. By late 2024, TSLA’s valuation dipped back to the same levels.
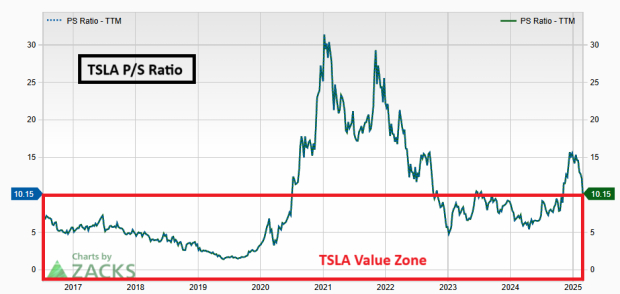
Image Source: Zacks Investment Research
Tesla Exits Transitional Period
In 2020, TSLA was exiting a transitional period. Finally, the Tesla Model Y would be released, and by 2023, it would be the world’s best-selling car. Currently, Tesla is exiting another transitional period. Tesla will soon launch Robotaxis in Austin, Texas, this summer – a project Elon Musk is confident enough to “bet the company on.”
How Did Tesla Perform in 2020?
After tagging the 200-day moving average in March 2020, TSLA shares would soar from ~$23 to $294 a share by January 2021! While history may not repeat itself exactly, based on history, the risk-reward looks very favorable to my eye.
Research Chief Names "Single Best Pick to Double"
From thousands of stocks, 5 Zacks experts each have chosen their favorite to skyrocket +100% or more in months to come. From those 5, Director of Research Sheraz Mian hand-picks one to have the most explosive upside of all.
This company targets millennial and Gen Z audiences, generating nearly $1 billion in revenue last quarter alone. A recent pullback makes now an ideal time to jump aboard. Of course, all our elite picks aren’t winners but this one could far surpass earlier Zacks’ Stocks Set to Double like Nano-X Imaging which shot up +129.6% in little more than 9 months.
Free: See Our Top Stock And 4 Runners UpTesla, Inc. (TSLA) : Free Stock Analysis Report
This article originally published on Zacks Investment Research (zacks.com).
The views and opinions expressed herein are the views and opinions of the author and do not necessarily reflect those of Nasdaq, Inc.

