
September, Third Quarter 2022 Review and Outlook
- Equity benchmarks are on course for one of their worst years on record
- The 10yr UST yield had its biggest monthly net gain in September
- Reverse currency wars are driving record moves in global FX
- The Fed hiked FFR 300bps since March, with another 125bps expected by year-end
- Economic data continues to reflect high inflation and slowing growth
The capital markets and asset classes are facing considerable disruption and volatility this year due in large part to the global response to soaring inflation and widespread geopolitical events, which are contributing to historic moves in equities, rates, and FX. Over the first three quarters of 2022, the S&P 500 has cemented its 3rd worst performance since the 1950s. The US Dollar Index (DXY) is having its strongest year on record (1967), while the Japanese Yen is having its weakest (1971). The 10YR UST yield has already seen its largest net gain since the early 1960s while recently touching a high of 4.02% after starting the year at 1.51%. Most commodities have reversed sharply lower from their 1H gains due to the meaningful slowdown in global economic activity.
In contrast to the post-GFC era race to the bottom, foreign central banks are trying to keep up with the Federal Reserve’s rapid pace of rate hikes to defend their local currencies and restore price stability and their own credibility. Over the prior five FOMC meetings from March through September, the Federal Reserve raised the overnight Fed Funds Rate by 300 bps. Markets are expecting another 125bps by year-end, which equates to 17 25bp rate hikes totaling 425 bps. At the start of the year, markets were pricing just three 25bp FFR hikes for all of 2022. Chair Powell’s Jackson Hole speech squashed any hope for a dovish pivot in the foreseeable future. Powell has since been adamant that the FOMC will do enough to return inflation to 2%.
After falling behind the curve in 2021, the Federal Reserve’s rush to normalization is reducing the chances for a “soft landing” while increasing the risk of a global recession and potentially other unintended consequences. In just the last two weeks, the central banks of Japan and China have reportedly intervened to support their local currencies, while policymakers in Britain were forced to implement new purchases of longer-duration Gilts, whose recent price declines were negatively impacting local pension funds.
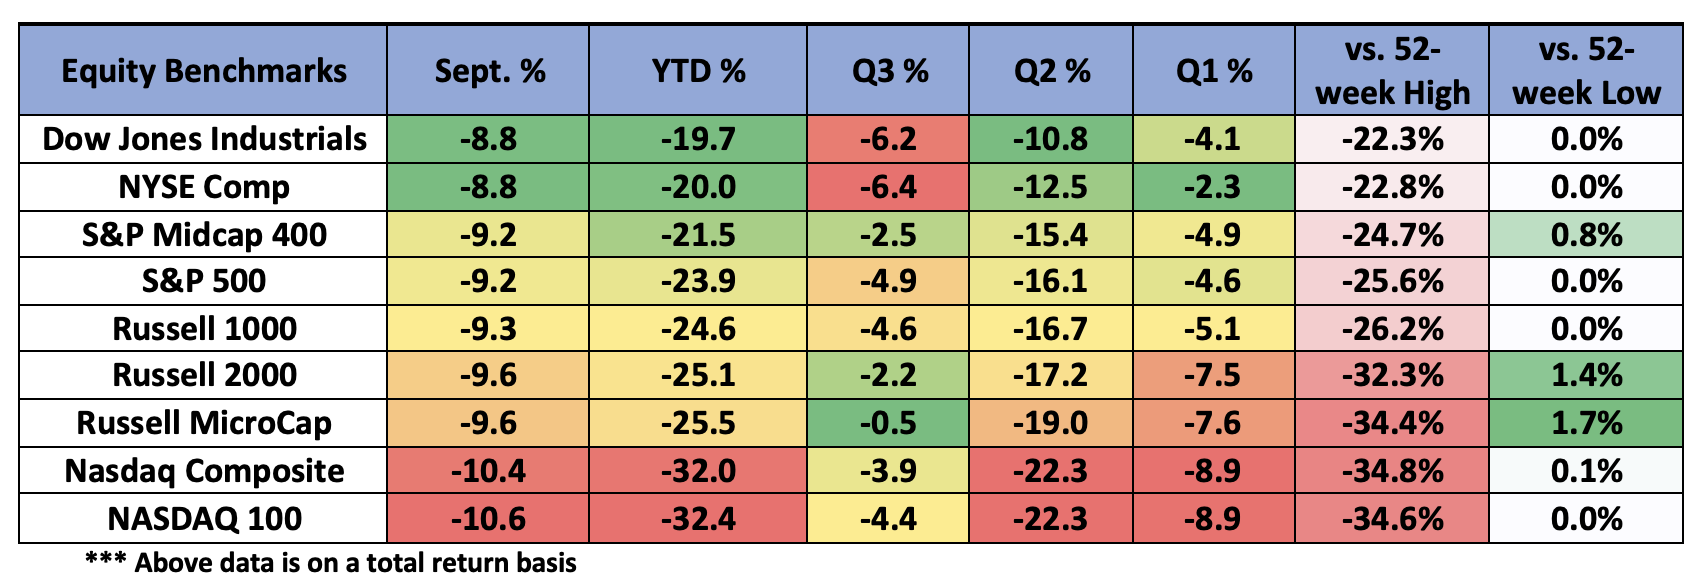
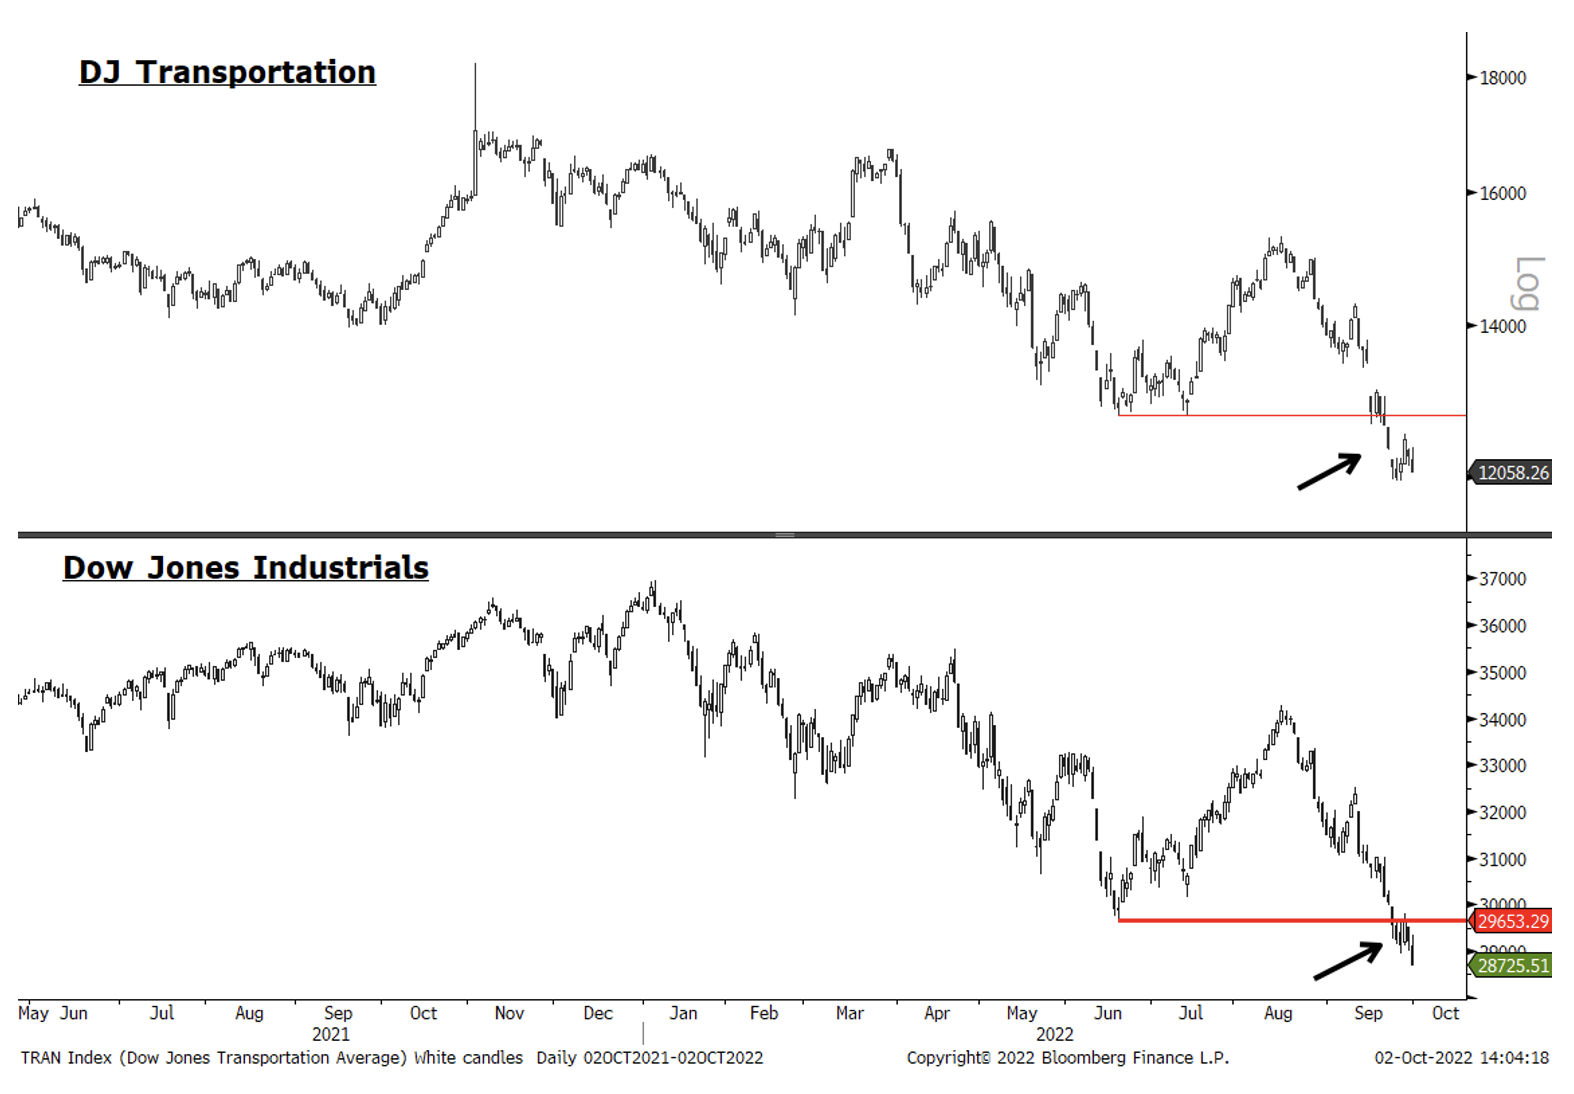
The major U.S. equity benchmarks were down between 8% and 11% in September, which historically has been the worst performing month for U.S. equities. The relative outperformer was the Dow Jones Industrials (-8.8%), while the growth-heavy Nasdaq 100 (-10.5%) was the laggard. The S&P 500 (-9.2%) closed at its lowest level since November 2020. In late September, all three large-cap benchmarks (INDU, SPX, NDX) broke down below their prior 52-week lows set earlier in June, increasing the risk for continued downside. The DJ Transportation Index confirmed the bearish trend by also registering new lows.

Large- and small-cap Growth outperformed Value in both September and Q3; however, on a YTD basis, Value is still the relative outperformer by the widest margin since the early 2000s. The sharp rise in rates has a greater negative impact on longer-duration growth stocks whose earnings power is further out into the future. The long-term trend of large-cap Growth outperforming Value, illustrated in the below ratio of the Russell 1000 Growth / Value indices, lasted from 2006 through 2020. The ratio broke a major technical support level earlier in May 2022, suggesting the recent Q3 trend of Growth outperformance was a temporary relief rally that could already be fading.

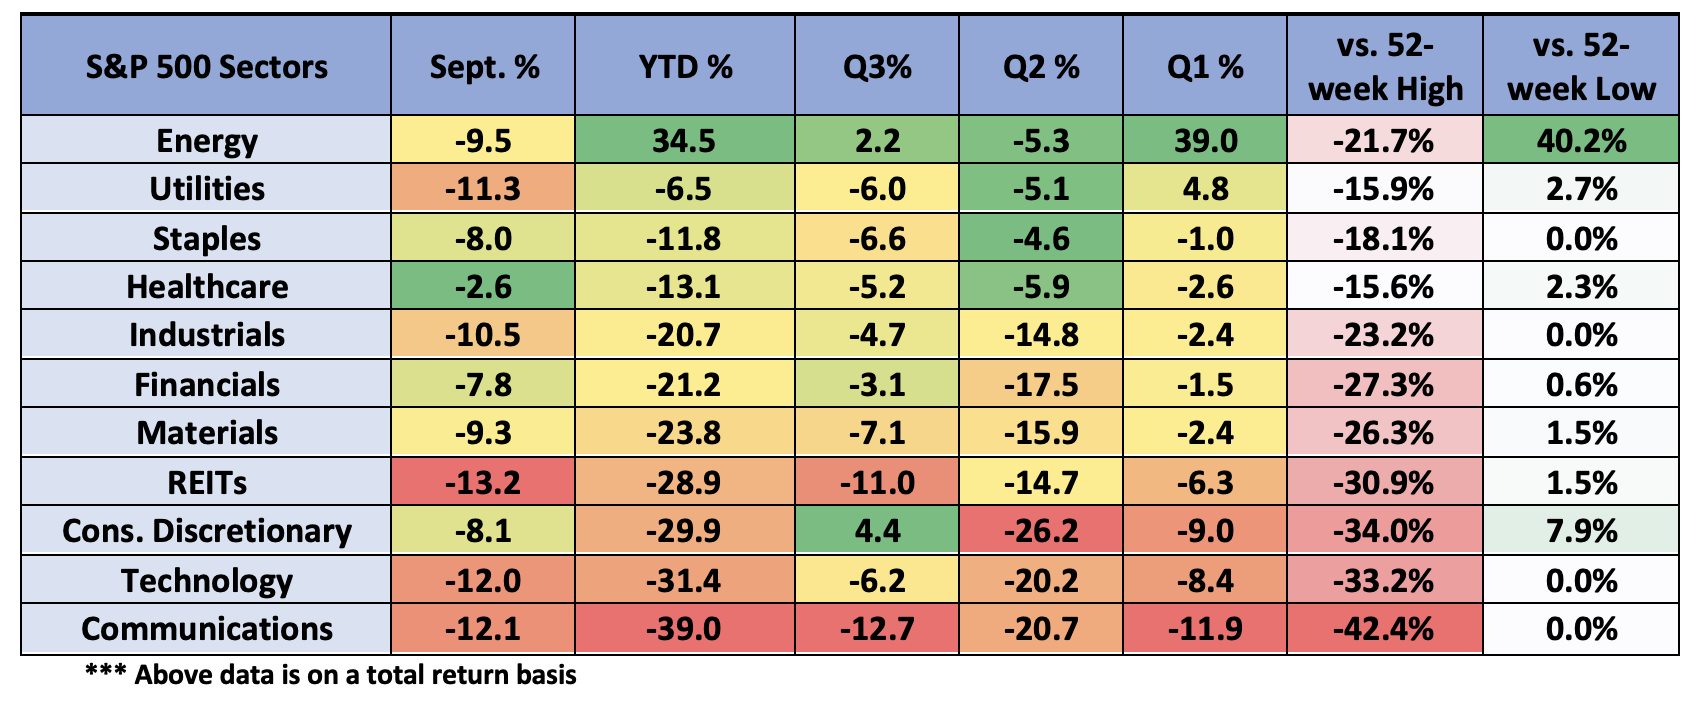
All eleven GICS sectors were lower in September, while Energy remains the only sector in the green YTD. While higher yielding defensive groups are outperforming on a YTD basis, September was this year’s worst performing month for both Utilities (-11.7%) and Staples (-8%) due in part to rising rates which now offer a more competitive yield over any time since the GFC.
Dollar, Rates, and Commodities
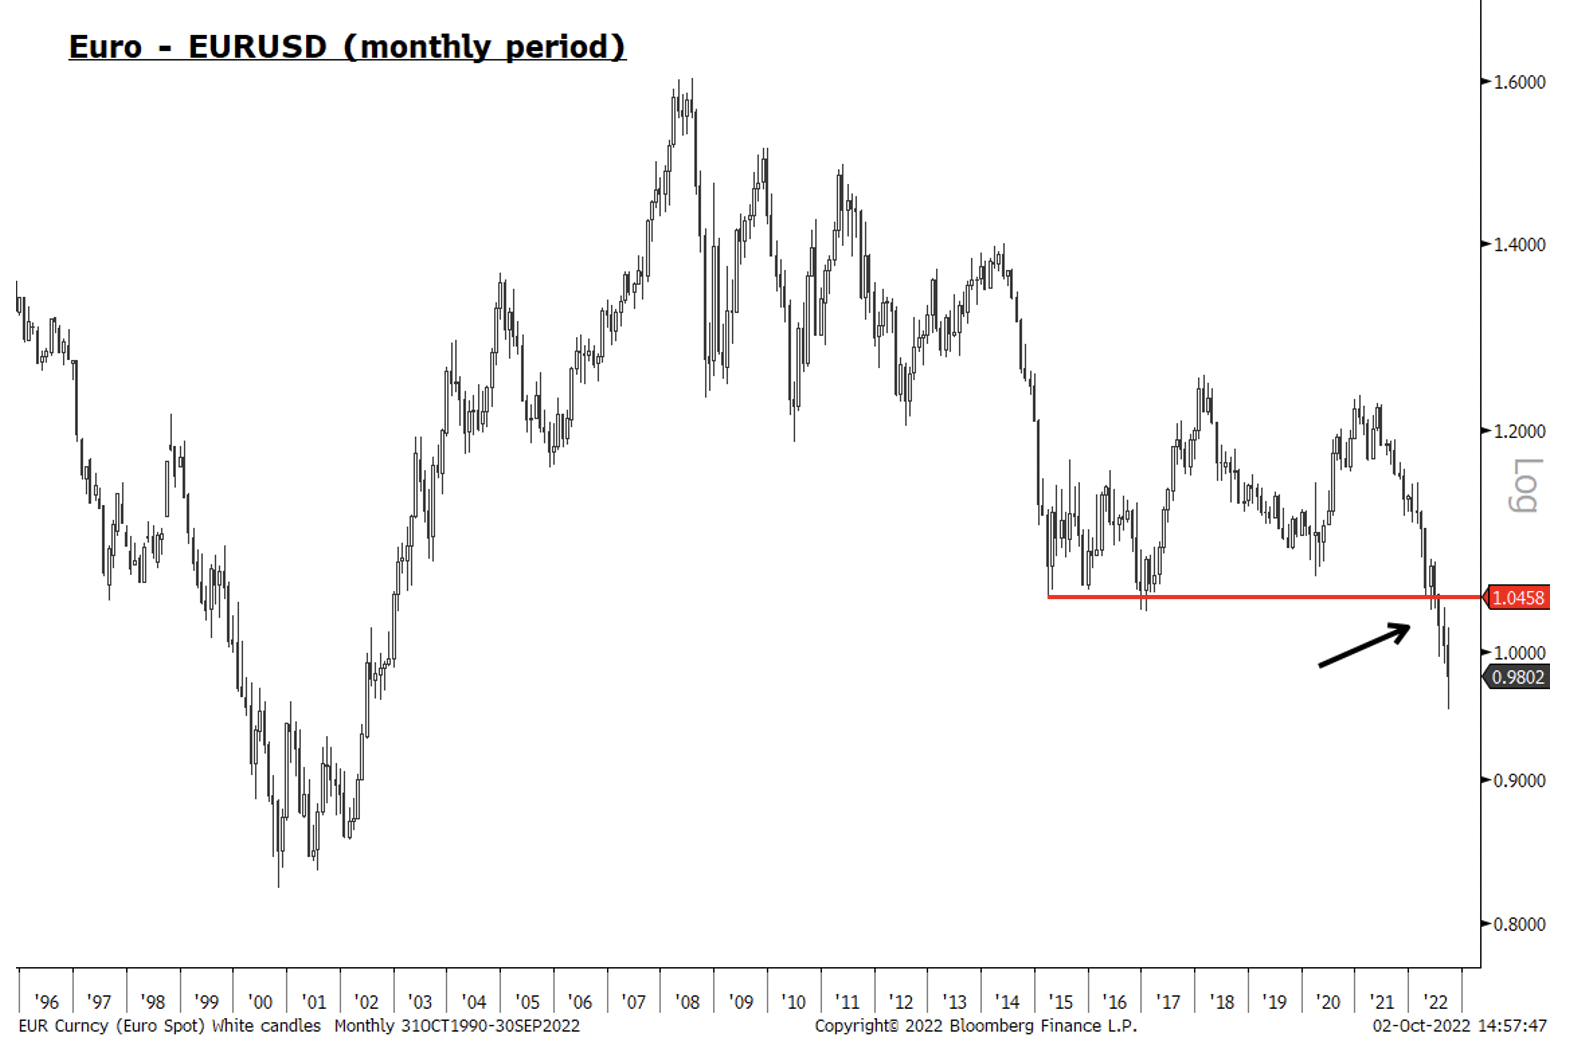
The U.S. Dollar Index (DXY) has gained 17.2% YTD marking its best annual gain on record (1967). The prior high of 15.8% was set in the 1981 Volcker era. The historic strength of the greenback has been a wrecking ball for other currencies. Accordingly, the Japanese Yen has declined a record 25.8%, while the Euro and British pound have declined 13.4% and 17.5%, respectively. The sharp rise in the global reserve currency increases debt servicing costs and trade for foreigners and is a significant headwind for global economic activity. In early Q3, the euro broke below a seven-year support level ($1.04/.05) before reaching its lowest level ($0.95) since 2002.
Treasury rates have seen a historic rise driven by inflation and the hawkish Fed. Just in the last two months, the 2yr, 3yr, and 5yr yields have risen 140bps. For the first time since the GFC, there is an alternative (TINA) for investors.
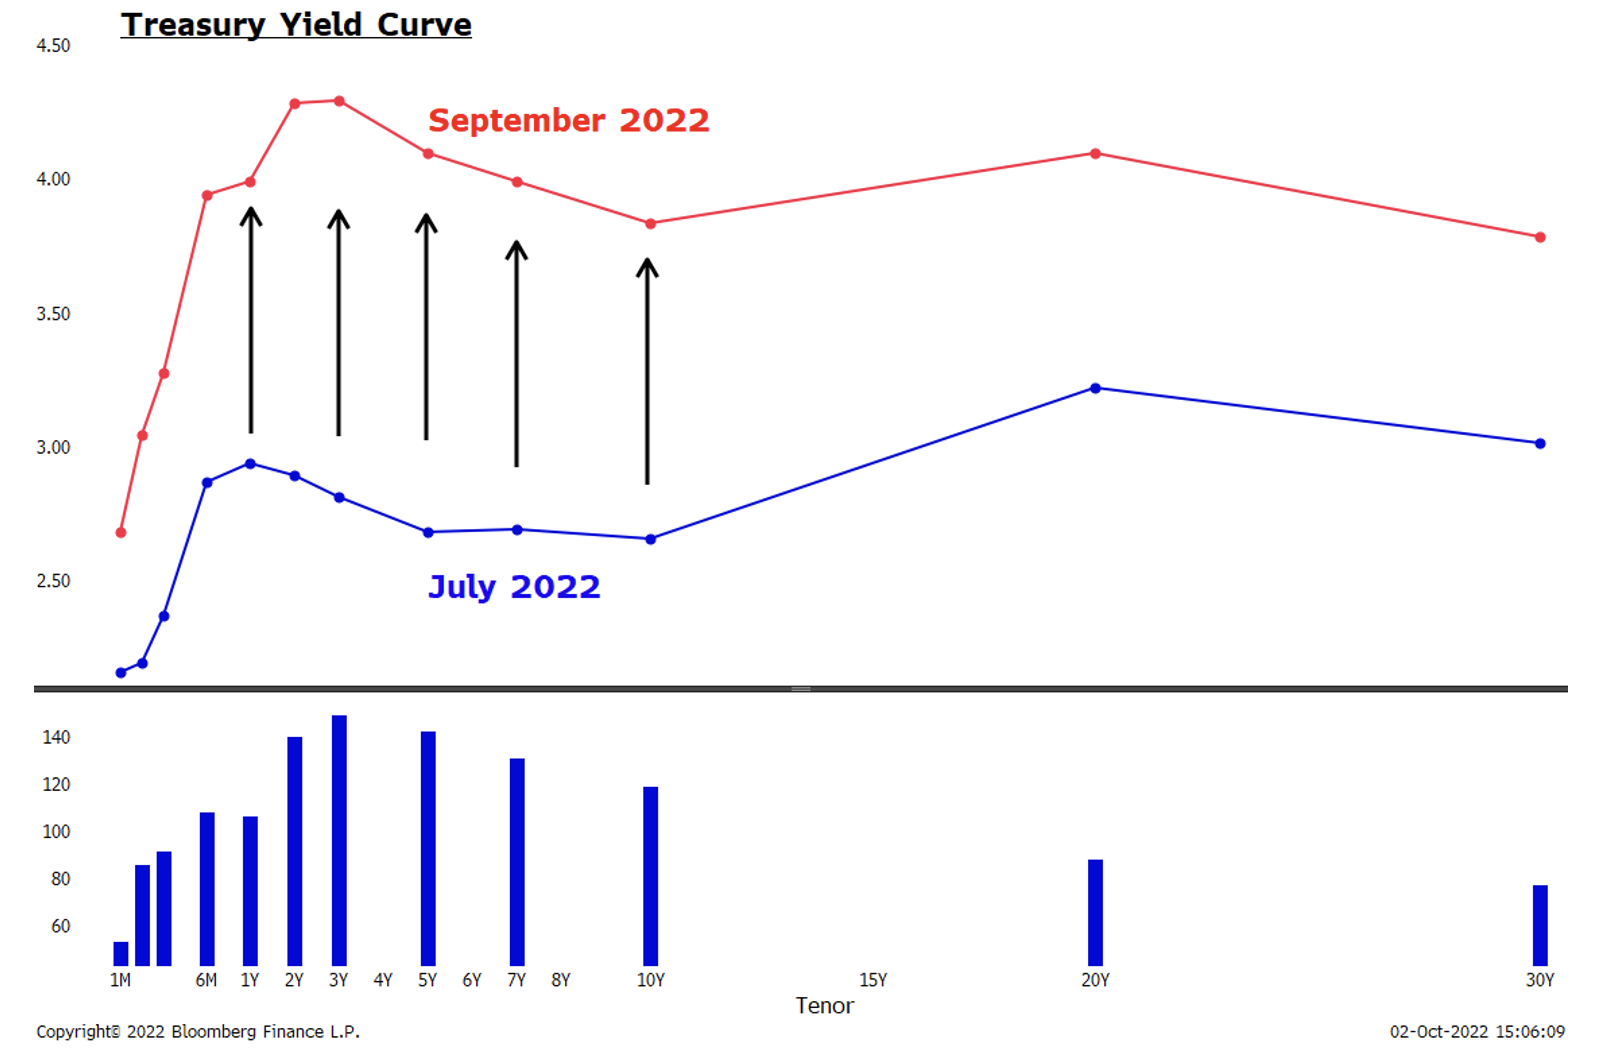
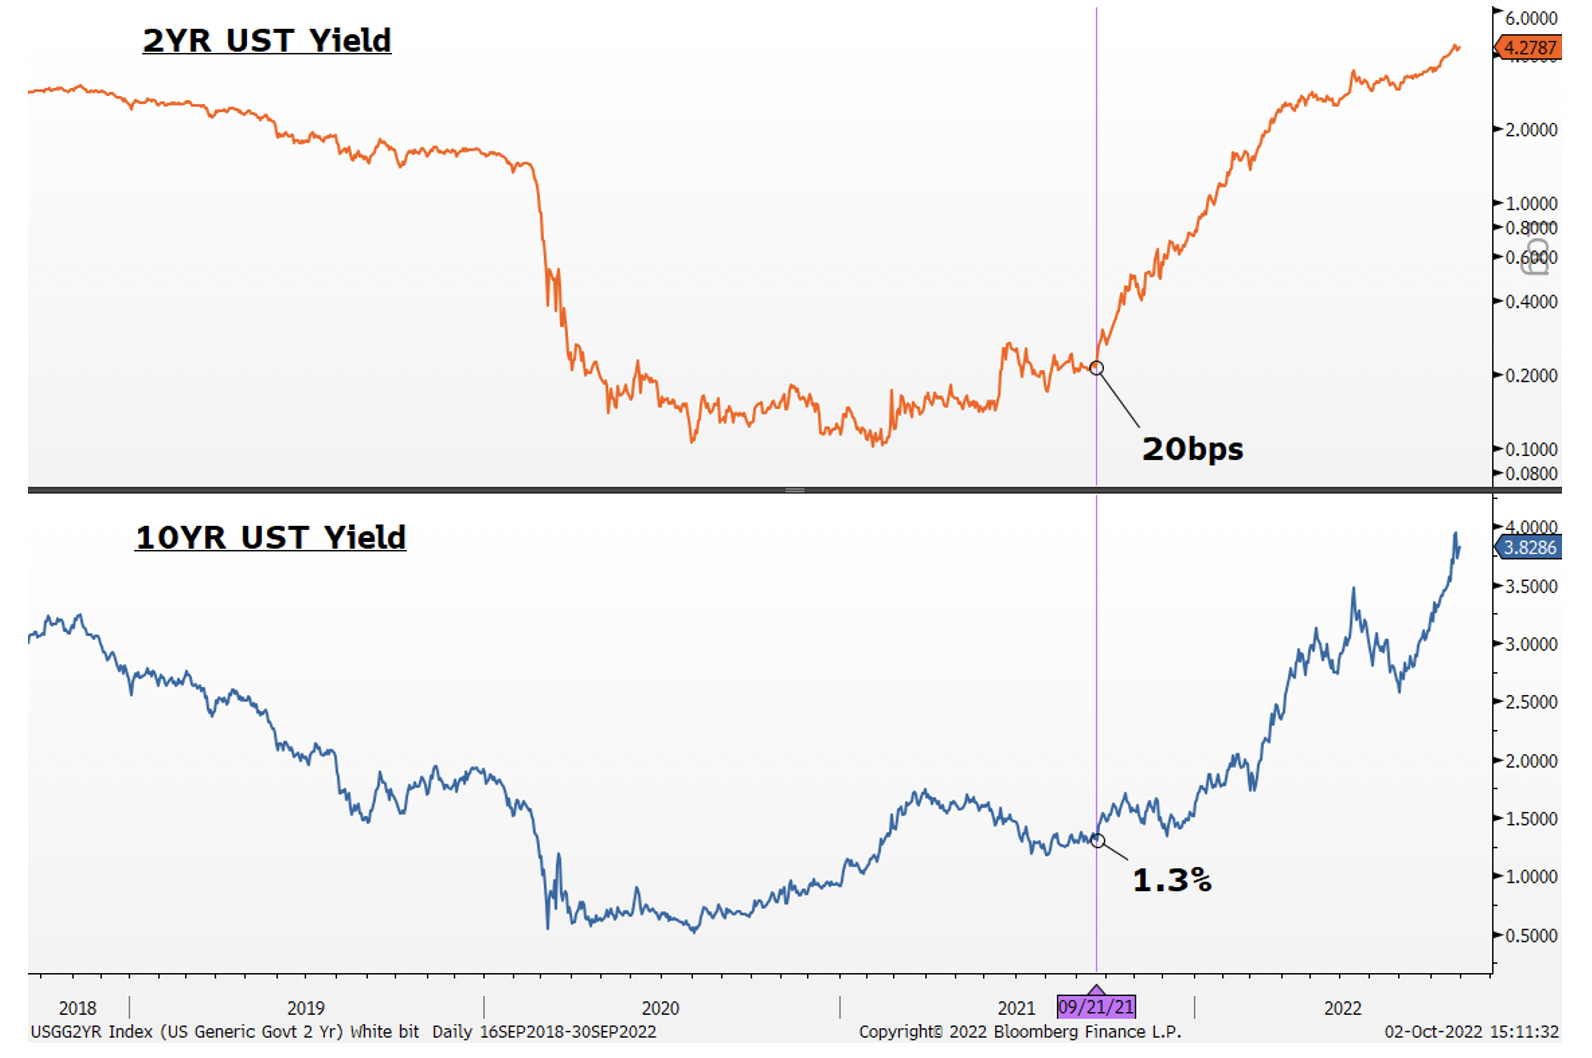
The 2yr UST yield rose 79bps in September to 4.28%. In September of 2021, the short yield was at 20bps. The 10yr UST yield gained 64bps to 3.83% for its largest monthly net gain in 2022.
The US Aggregate Bond Index is down 14.6% YTD. Since 1976 it has never declined more than 3%. The Global Aggregate Bond Index is down 19.9% versus its prior record decline of 5.2% in 1999. There are increasing fears that the dramatic fall in bond prices could create a “break” of some sort in the global financial system, which could force a central bank to pivot. Britain’s recent intervention in long-duration Gilts could be viewed as the first pivot from unintended consequences related to high debt levels and hawkish central bank policies.

WTI crude dropped 11.2% in September, marking its biggest monthly decline in 2022 and its 4th consecutive month in the red. While inventories remain tight, demand continues to fall due in part to the slowdown in the global economy. Copper (-3%) declined for the 6th consecutive month. Precious metals were mixed, with gold declining 3% and silver gaining 5.8%.
Economic data reflects both the elevated rise in inflation as well as the increasing slowdown in economic activity. The most recent headline and core CPI data came in above consensus, with the core increasing 6.3% in August vs. 5.9% in July. The 3rd revision to core PCE, widely viewed as the Fed’s favored inflation gauge, increased 4.7% versus expectations of 4.4%. Chairman Powell recently said the goal is to get all rates above the level of inflation.
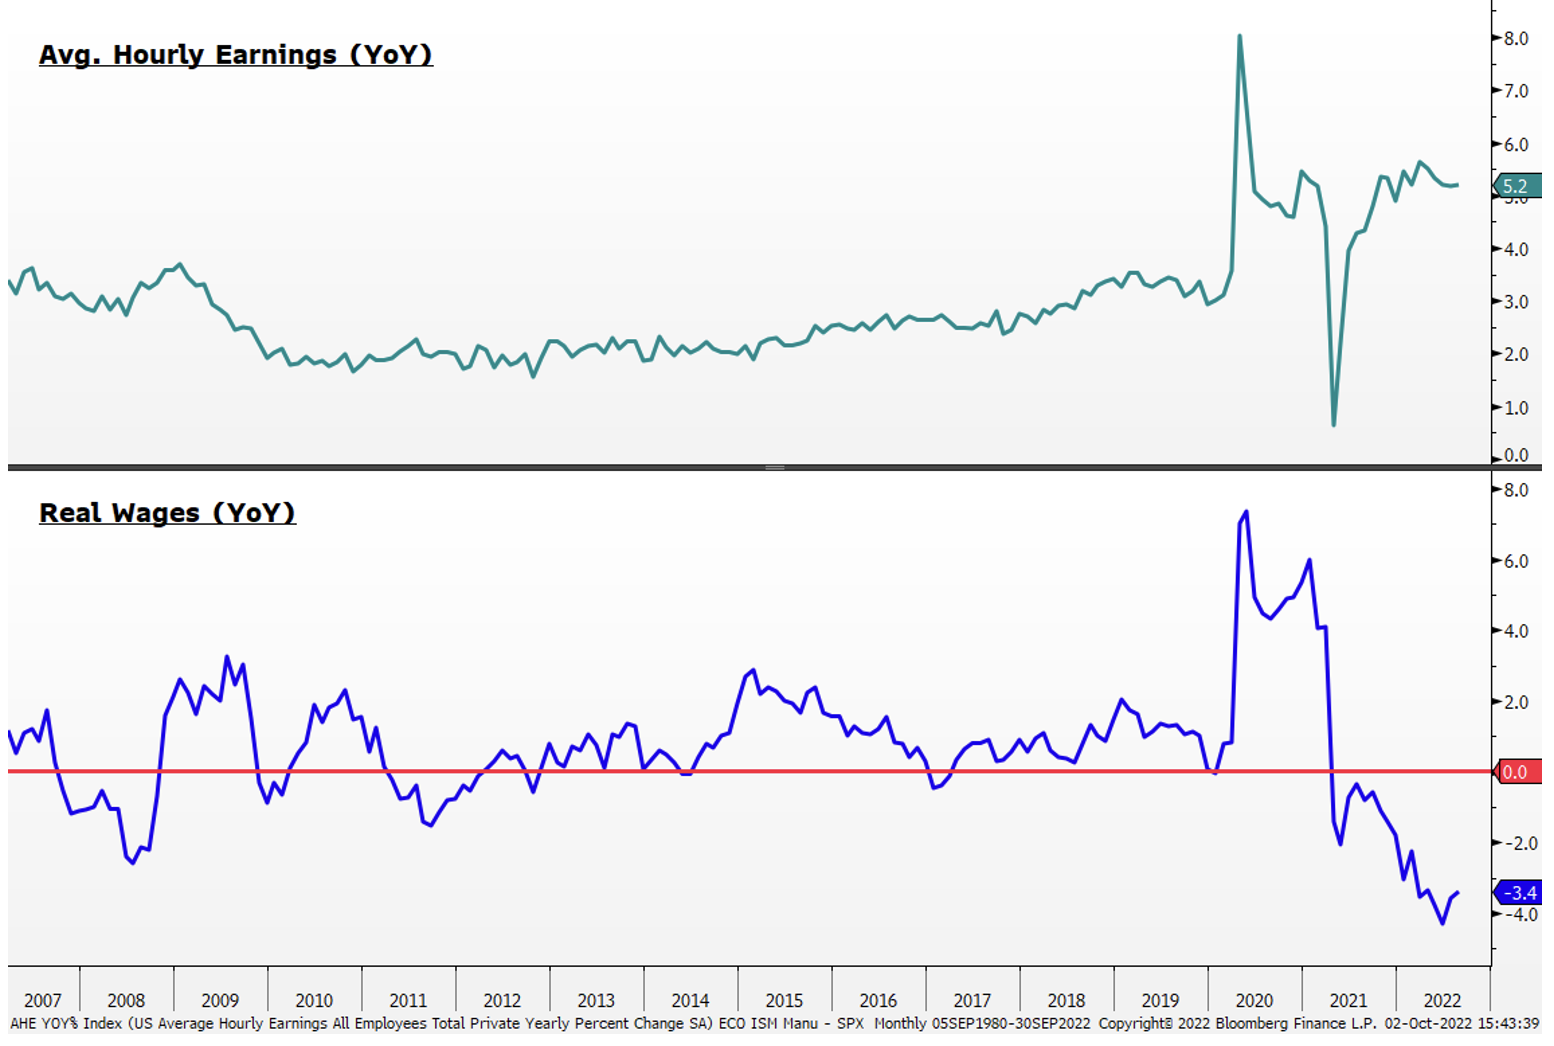
The labor market remains tight, with the Unemployment rate (3.7%) near generational lows, and the ratio of job openings to unemployed is at a record 2-1. While average hourly earnings (YoY) have been above 5% every month in 2022, real wages have been down between (3.4%) and (4%) since June, which may explain the recent record low in consumer sentiment.
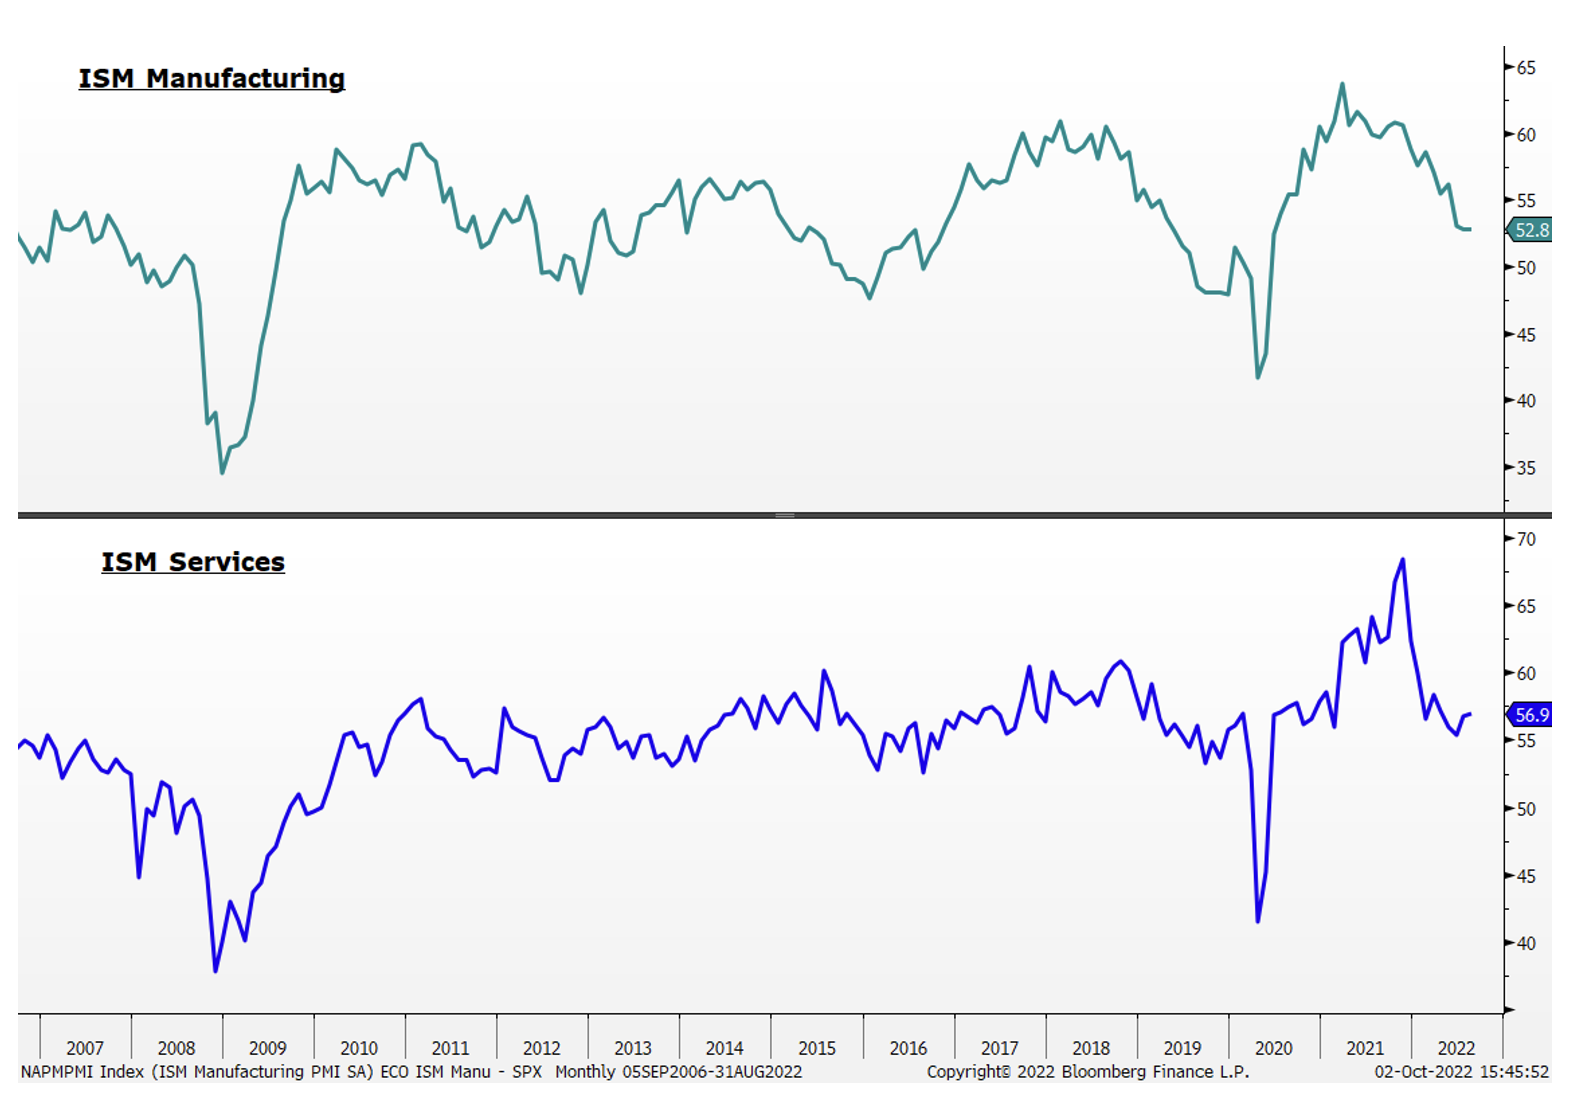
ISM manufacturing (52.8) and services (56.7) are trending lower but remain within expansionary levels (> 50), while New Orders rebounded to 51.3 in August from a contractionary 48 in July.
Looking Ahead
The markets appear to be at a significant inflection point heading into Q4. Long rates are coming off their biggest monthly gain in 2022, suggesting there is further upside as prices (yields) often peak after momentum or rate of change. Bond prices, in aggregate, are falling multiples of prior record declines, raising concerns that could result in negative unintended consequences in the plumbing of the financial system. Equity benchmarks are just beginning to make fresh lows previously established three months earlier in June. While earnings multiples have compressed sharply, we have not yet seen the effect of significant earnings estimate revisions, though this could be a factor as earnings season begins. According to FactSet, the Q3 bottom-up EPS estimate for S&P 500 companies decreased by 6.6% (to $55.51 from $59.44) from June 30 to Sept. 29.
Elevated inflation, the sharp rise in global rates, and the strengthening greenback have been significant headwinds to the rest of the globe, which recently has led to central bank intervention in local FX and treasury markets. The Federal Reserve is only a few weeks into its elevated level of QT as the government balance sheet remains close to $9T. Markets are expecting another 125 bps in rate hikes over the final two FOMC meetings in 2022, with the lagging economic impact of prior hikes still to come. Meanwhile, geopolitical risks remain a wildcard, as evidenced by the recent sabotage of the Nord Stream gas pipelines.
The information contained herein is provided for informational and educational purposes only, and nothing contained herein should be construed as investment advice, either on behalf of a particular security or an overall investment strategy. All information contained herein is obtained by Nasdaq from sources believed by Nasdaq to be accurate and reliable. However, all information is provided “as is” without warranty of any kind. ADVICE FROM A SECURITIES PROFESSIONAL IS STRONGLY ADVISED
The views and opinions expressed herein are the views and opinions of the author and do not necessarily reflect those of Nasdaq, Inc.
