Sectors Have Styles Too
We recently talked about some of the quantitative ways investors use to pick stocks, focusing on size and style factors.
Styles typically refer to a stock being “growth” or “value” oriented:
- Value is typically stocks that look “less expensive” based on current earnings. Metrics like a low price to book or higher dividend yield are frequently used to detect them.
- Growth is designed to detect stocks whose revenues, and therefore valuations and prices, are expected to grow more quickly. Metrics like historical or expected growth in earnings or sales or high price-earnings ratios are frequently used.
Today, we take what we learned from the last report and use it to compare how styles change across sectors. What we see is that sectors often have style too.
Slicing the universe into industries and sectors
Sectors themselves are something that thematic investors often use to segment the investment universe.
For example, if oil prices go up, energy companies should make more profits. Similarly, as the COVID-19 pandemic hit, a number of healthcare and biotech companies (like Moderna [MRNA]) were expected to benefit. Then, once lockdowns and work-from-home increased, online commerce (like Zoom [ZM] and Amazon [AMZN]) benefited, while companies in the hotel, cruise and airline industries suffered.
Index providers typically assign a specific industry or sector to each company they track. Often, those industries are then divided into even smaller and more focused sub-sectors.
Industry and sector groups are typically based on the types of products or services a business produces.
For example:
- A company producing soft drinks (e.g., PepsiCo [PEP]) is labeled as Consumer Staples vs. a company developing medicines (e.g., Gilead Sciences [GILD]) could be characterized as Health Care.
- However, companies producing personal care goods (e.g., Procter & Gamble [PG]) or retail pharmaceutical products (e.g., Walgreens Boots Alliance [WBA] or CVS Health [CVS]) would also be examples of Consumer Staples businesses, even though their products are very different from soft drinks (e.g., PepsiCo).
- Because of that, and to allow investors to find similar stocks, Procter & Gamble could be further classified as Personal Products, while Walgreens & CVS could be further classified as Drug Retailers, and PEP could be further classified as Soft Drinks.
Not all indexes use the same sector classification. However, there are two broadly used sector classifications that the majority of indexes use:
- MSCI and S&P indexes share the GICS (Global Industry Classification Standard) ruleset.
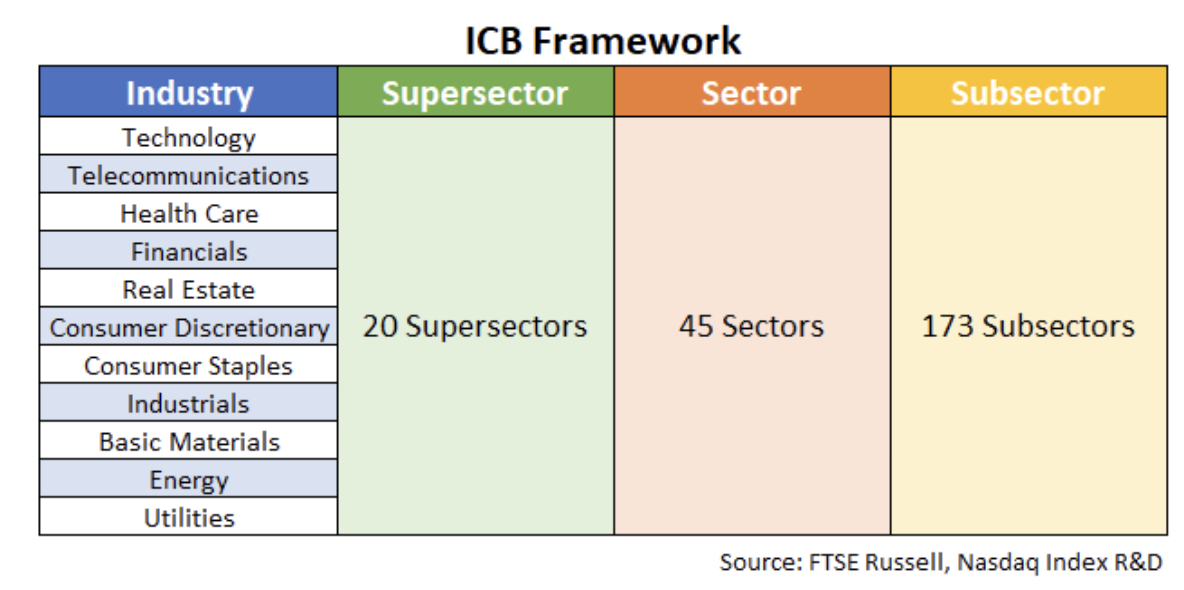
- FTSE, Russell and Nasdaq share the ICB (Industry Classification Benchmark) system.
Both have 11 groups at the most macro level. However, even how those work is slightly different:
- GICS takes a ‘market-oriented’ approach, where companies are grouped based on how their products are used by customers. For example, GICS classifies Alphabet (GOOG/GOOGL) as Communication Services.
- ICB takes a product-oriented approach, where stocks are grouped based on the products produced. For example, ICB groups Alphabet (GOOG/GOOGL) as Technology.
ICB calls its largest group an “industry” group, and then divides those into different supersectors, which are further divided into more granular sectors and subsectors (Table 1).
Table 1: ICB classifications

ETFs make trading sectors easy
There are a lot of ETFs that allow investors to buy or sell sector (or subsector) exposures. For example, looking at transport, you can trade the whole transport sector using ETFs like XTN and IYT to the more thematic airline ETF (JETS).
These ETFs use a variety of sector classifications, but to keep things consistent below, we use FactSet classifications to group ETPs by economic exposure.
Style score for sectors
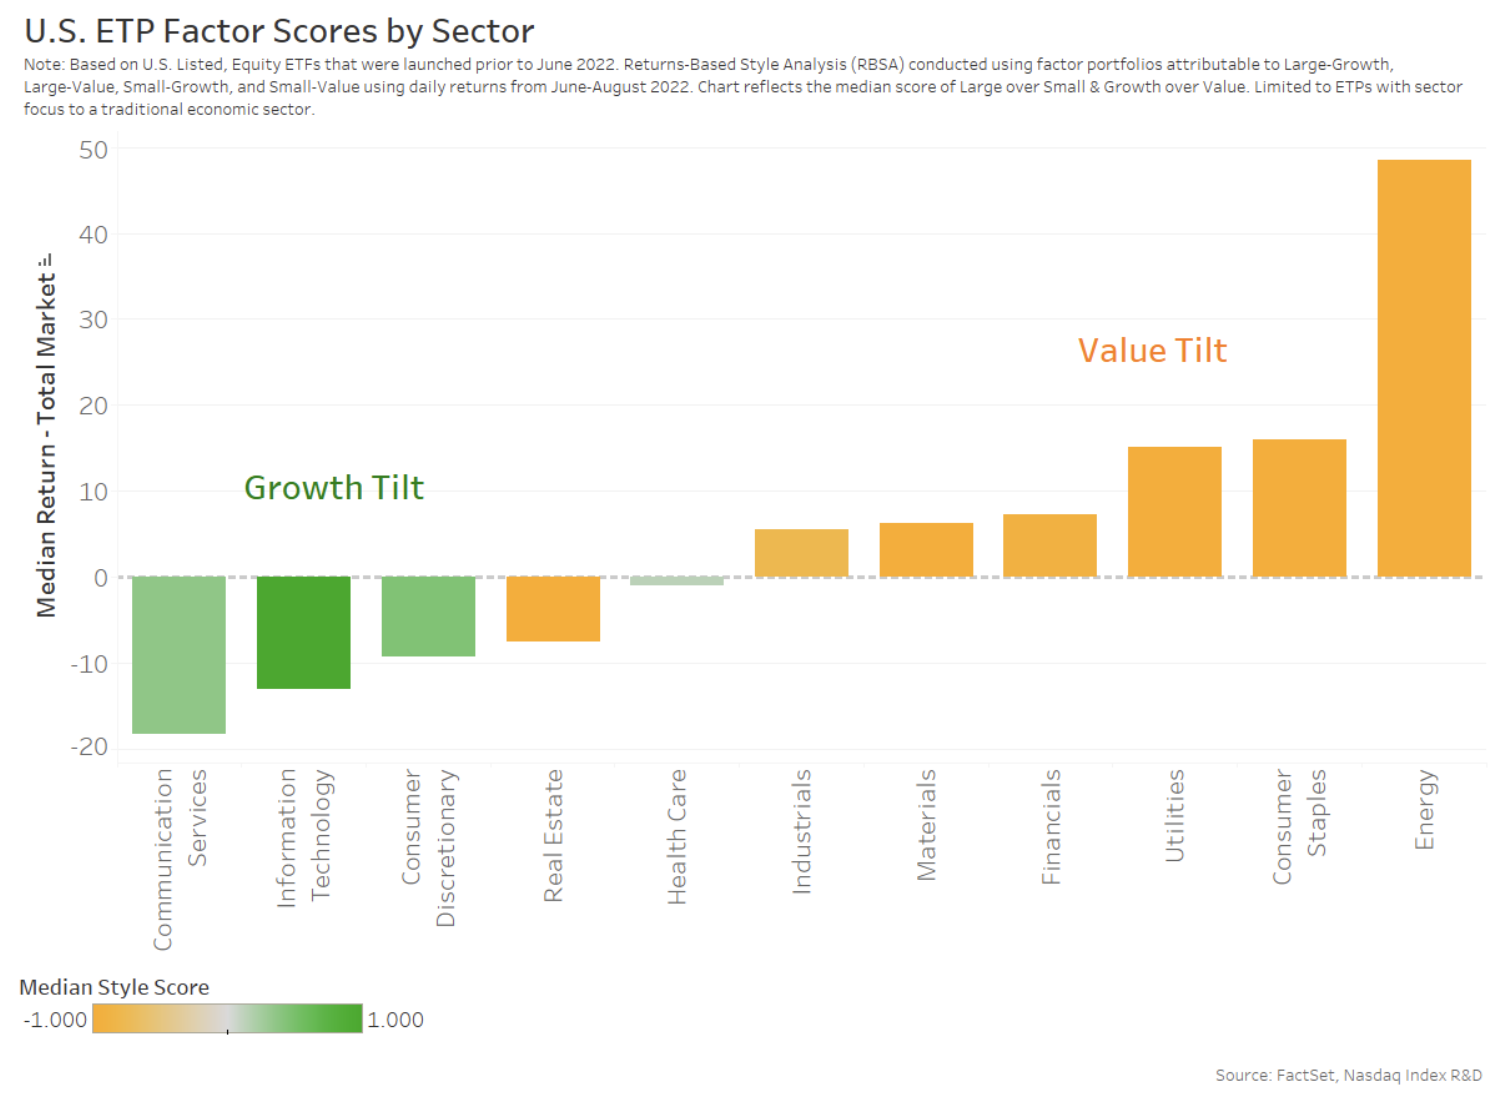
If we use the same technique to score ETPs by size and style, we can see each sector also has a different style. The results are in Chart 1 below. Each bar shows the median 2022 return (vs. the market) across a sample of ETPs from that sector. We then color each bar by the style score (Value is orange and Growth is green). From this, we see, in 2022:
- Value-tilted sectors mostly outperformed.
- While growth sectors underperformed thanks to rising interest rates penalizing the valuation of earnings from future years.
- Energy was the leading sector last year, thanks to the increase in prices for oil and gas caused by the Ukraine war. However, the color shows that the energy sector has a strong value tilt.
- Consumer Staples and Consumer Discretionary sectors are verydifferent (returns and styles). Staples are products that most consumers need to buy, like food, which makes them more value tilted. Meanwhile, consumers can typically exercise choice about whether or not to buy discretionary products – like Amazon (AMZN), Telsa (TSLA), or Starbucks (SBUX) – resulting in their sales growing more in stronger economies, giving them a growth tilt.
- Real Estate is also interesting. Because rent income is fairly consistent, these tend to fall in line with ‘value’ style, but because rent income didn’t change as much as interest rates (or inflation), the sector underperformed the market.
- Communications includes companies like T-Mobile (TMUS) and Comcast (CMCSA), as well as companies that some might consider “tech-like,” including Meta Platforms (META) and Netflix (NFLX). Interestingly, GICS classifies META and Netflix as CommunicationServices, although ICB classifies them as Technology, and Consumer Discretionary, respectively. Although, as a whole, the Communications sector has some stocks with value characteristics (making them a fainter green), their performance last year was very similar to tech company returns.
Chart 1: Sector styles for ETPs

Not all sector ETFs are equal
Chart 1 shows the median of a sample of ETFs in each sector.
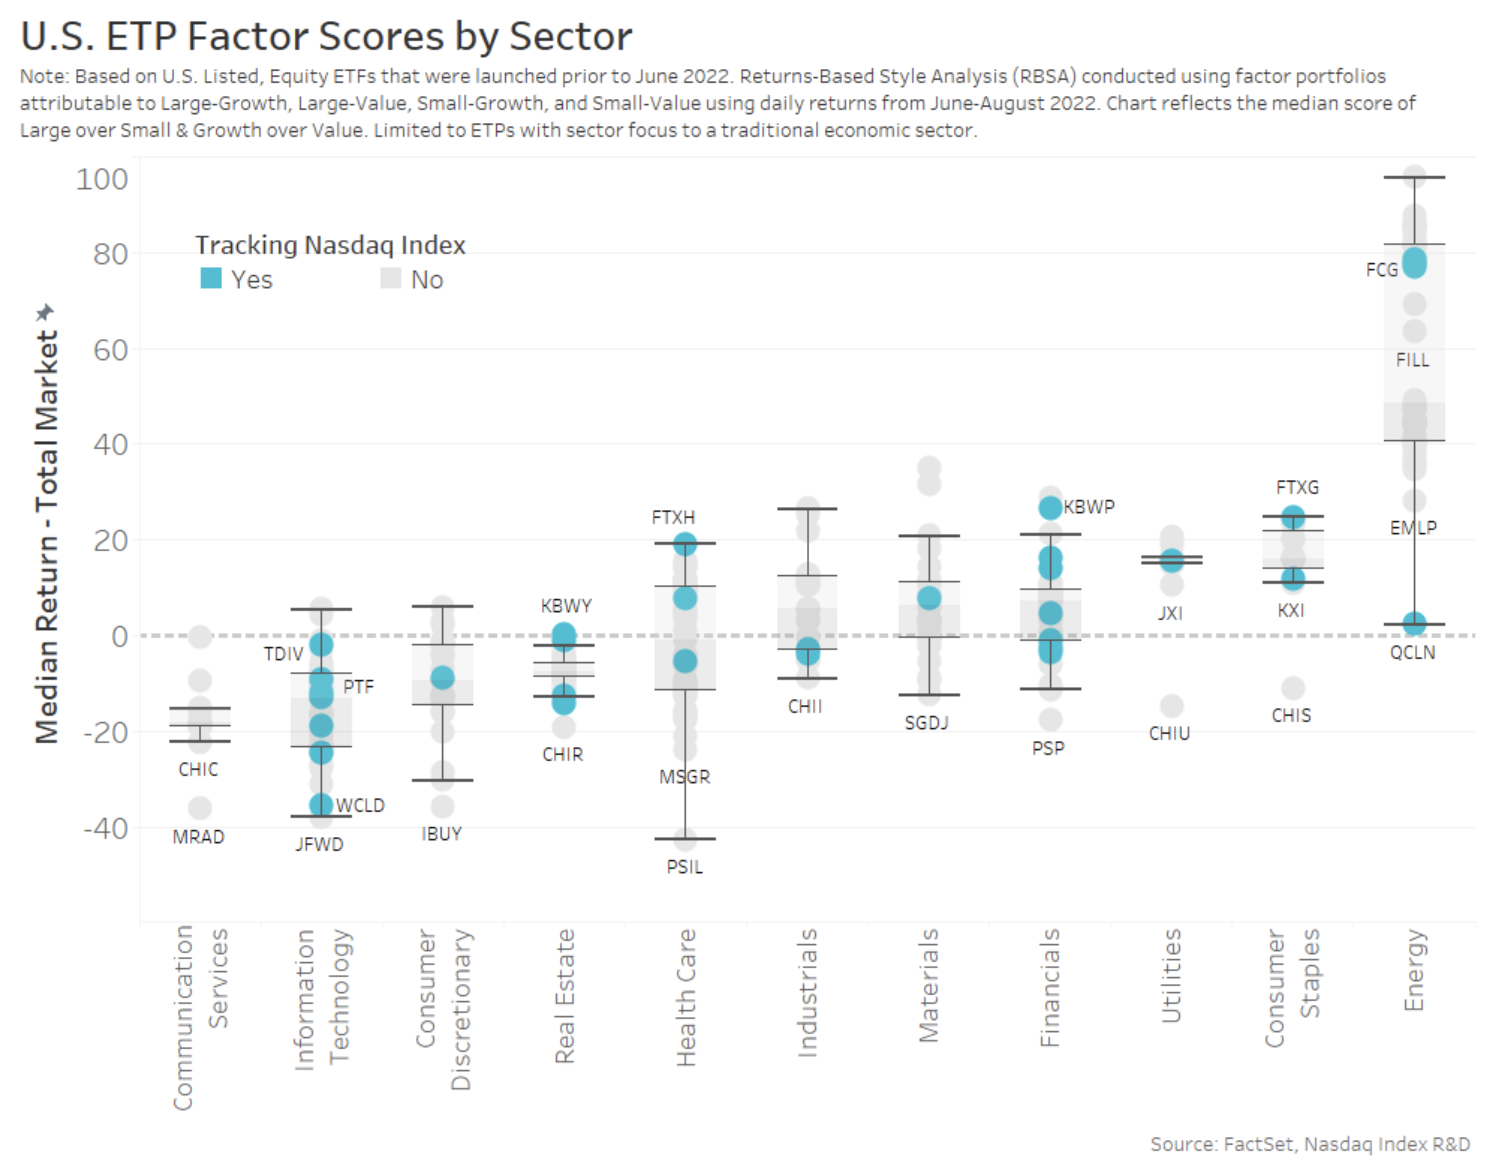
Looking at the returns of each ETF within the sector shows returns and styles can also be very different. In Chart 2, each dot is a different ETF from that sector (blue dots are ETPs tracking a Nasdaq Index). Some key sectors worth highlighting are:
- Energy: Although most Energy ETFs beat the strongest performance from any other sector, there were some standouts and laggards: FCG (tracking FUM - ISE-REVERE Natural Gas™ Index) is a very specific exposure to Natural Gas commodity, while QCLN (tracking CELS - Nasdaq Clean Edge Green Energy™) is actually tied to the Alternative Energy sector and has not yet seen the benefits of stimulus provided in Biden’s Inflation Reduction Act.
- Financials: KBWP (tracking KPX - KBW Nasdaq Property & Casualty™ Index) outperformed the market by over 20%, despite broader Financials ETPs slightly outperforming by only around ~7%.
- Technology: Despite the median Technology ETP underperforming the market by ~13%, TDIV (tracking the Nasdaq Technology Dividend™ Index) actually traded more in-line with the market. Although given what we now know about style performance in 2022, this makes sense, as TDIV has a ‘value’ tilt due to its focus on high dividend-paying Tech stocks.
Chart 2: Performance of ETPs within ICB industry groups

What does this all mean?
Sectors and styles are both useful ways to filter for companies that will outperform due to different economic conditions and catalysts.
However, as we see today, sectors have style, too, which can also be important when it comes to picking a specific sector ETF to express your views.
This all makes understanding styles important for your own stock (and ETF) selection.
The views and opinions expressed herein are the views and opinions of the author and do not necessarily reflect those of Nasdaq, Inc.

