
Risk Modeling Assumptions and Techniques for Multi-Asset Portfolios
Nasdaq Asset Owner Solutions
The institutional market’s only comprehensive data, analytics and decision-support platform.
Learn MoreBY ALEXANDER ERMAKOV | SOLOVIS RESEARCH & DEVELOPMENT
Risk modeling comes in varying shapes and sizes throughout the financial world. Having previously worked as a derivatives trader on the Chicago Board Options Exchange and as a senior risk analyst, I thought I had encountered most approaches. Looking back though, the risk models employed were primarily geared toward estimating potential losses in adverse scenarios. These models served as more of an oversight function to monitor proprietary trading portfolios, and less as an explanatory tool of portfolio risk and return.
The multi-factor regression model offered by Solovis, part of Nasdaq Asset Owners Solutions, targets the asset allocator community, and not only allows users to understand total portfolio risk and plan for adverse shock scenarios, but also deconstructs the portfolio into its key risk and return drivers, all in a more comprehensive and holistic platform. In this post, we will outline some of the modeling assumptions and techniques of the Solovis Risk tool that enable us to model our clients’ multi-asset class portfolios.
One of the difficulties underlying risk analysis for most organizations is the disconnect between their data and their risk modeling tool set. As a result, many organizations still leverage Excel or spend copious amounts of time uploading their positions into stand-alone risk systems. This can be inefficient and error prone. In contrast, the positional and market value inputs to the Solovis Risk model are downstream of our clients’ main data warehouse environment, Solovis Portfolio Analytics. This eliminates an entire leg of the process for our clients, thereby reducing error of the initial data load, and also allowing for automated ongoing positional maintenance. Additionally, flexible slicing and dicing and compositing mechanisms that exist within Solovis Portfolio Analytics flow through seamlessly into the Solovis Risk tool. Leveraging this backbone of accurate data and flexible portfolio selection and aggregation enables us to employ the following modeling methodologies.
A factor approach is used to break out the individual risk drivers of each investment within the portfolio. In addition to our default house model, asset owners can customize by adding their own factors or working with us to create new custom ones. The risk modeling approach for each security type varies due to fundamental differences in how they behave and trade.
Public Equities
Modeled using their historical returns (including dividends) from our security master.
Fixed Income Securities
Modeled by calculating duration, convexity, and spread, then generating returns from historical rate and spread changes. There are a couple reasons for taking this approach. First, some bonds do not have enough history to generate a robust risk output. Secondly, using historical price changes would estimate the risk of that bond over the average duration over the look-back period. For example, for a five-year bond with one year remaining to expiration, a model utilizing the prior two years of returns to estimate risk would reflect the risk of a bond with two years until expiration (reflective of the fact that over the past two years, the bond went from a three-year bond to a one-year bond) and would not reflect the risk of a bond with just one year remaining. The result would be an over-estimation of duration and interest rate risk.
Derivatives
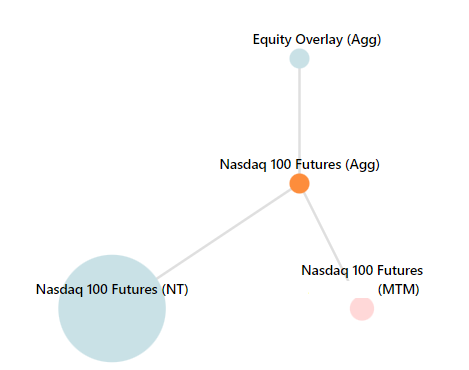
Modeled by deconstructing these positions into their notional and mark-to-market components. We are then able to model the risk of those legs as exposures to the underlying security/index. OTC derivatives are also modeled as exposures to the underlying securities with sensitivities calculated by our models and client prices.
Private Assets
Modeled using public proxies based on their underlying exposures leveraging this information in the primary Portfolio Analytics tool. In contrast to leveraging private returns which are lagged and infrequent, asset owners can model the risk and return of their private portfolios within the context of their total portfolio on a daily/weekly/monthly basis. One of the benefits of such granular modeling allows for clients to understand allocations across their asset classes in all market scenarios, including sharp drawdowns.
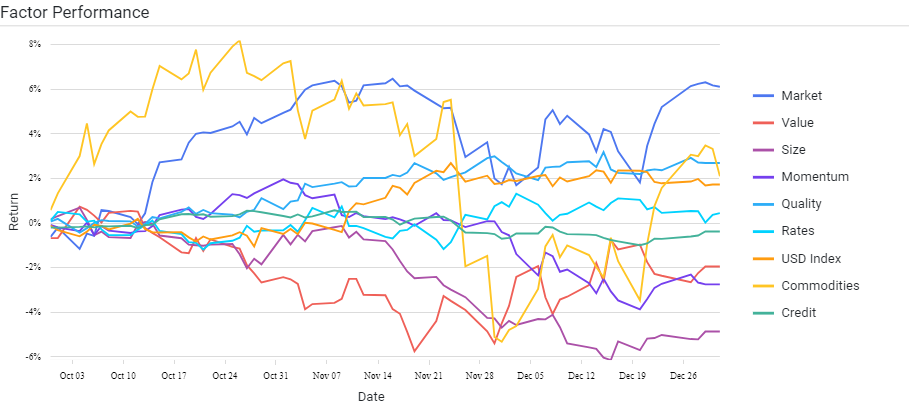
Once we have calculated the security level risk characteristics, we are then able to aggregate these up to fund, asset class, and portfolio levels. We believe that using current holdings to calculate fund and portfolio risk metrics provides the best estimate of ex-ante risk. A default set of factors are available through the Solovis Global Macro model, which offers broad macro factors and equity styles that explain the primary sources of risk and return in a diversified multi-asset class portfolio. It consists of the following factors and indices:
- Market – MSCI ACWI Total Return
- Value – Long MSCI ACWI Value / Short MSCI ACWI Growth
- Size – Long MSCI ACWI Small Cap / Short MSCI ACWI Large Cap
- Momentum – Long MSCI ACWI Momentum / Short MSCI ACWI
- Quality – Long MSCI Quality / Short MSCI ACWI
- Rates – Bloomberg Barclays UST 20+ Total Return
- Spreads – ICE BAML US Corporate Credit OAS
- Commodities – S&P GSCI Total Return
- Currencies – USD Index
A sample output of this model is illustrated below. You will notice that the four equity style factors are custom indexes created from long-short pairs to remove the impact of the market and reduce collinearity between itself versus the market, and versus other equity styles.
Our default model leverages two years of weekly returns for purposes of calculating volatility, as these correlations tend to be understated using a daily method. We use weekly returns to account for time zone differences between US and foreign equity markets. The two-year window reflects a lookback that caters to the typical allocator long-term investment mindset, while also capturing a relatively current risk profile for their portfolio.
Understanding the model parameters is critical to understanding the risk outputs. For example, as of today, the two-year look-back window would include the heightened period of volatility during the start of the Covid pandemic in March 2020. In April 2022 however, the two-year lookback will no longer include this period, and risk numbers will likely drop significantly at this time. Asset owners should be aware that the time period sampled can have a significant impact on risk outputs, and that changes can often be driven by sampling differences rather than changes in portfolio composition.
The Solovis Risk team at Nasdaq Asset Owner Solutions is comprised of investment experts with varied experiences in financial markets and portfolio risk. The Solovis Risk tool is an aggregation of that experience and expertise. Connect with us for the opportunity to help you better understand the sources of risk within your portfolio and help you quantify and intelligently limit the potential downsides.
About the author:
Alexander Ermakov has worked on the Solovis Research and Development team since the start of 2020. He graduated from Harvard in 2009, where he studied Economics. Prior to Solovis, Alexander worked as a derivatives market maker in Chicago at Consolidated Trading and Akuna Capital and as a Senior Risk Analyst at Apex Clearing in Dallas.

Do You Know What’s Driving Your Portfolio Risk?
Dive deeper in this new whitepaper to learn how risk factors affect multi-asset class portfolios for institutional investors.
Other Topics
Derivatives Private Markets Markets Fixed Income
Nasdaq for Asset Owners
Nasdaq
Delivering insights and intelligence for institutional investors
Read Nasdaq for Asset Owners 's Bio