Relative Strength Index
The Relative Strength Index (RSI) is an oscillator that is similar to the stochastic indicator in that it identifies overbought and oversold conditions. The basis of the oscillator is that it measures the magnitude and velocity of directional price movements.
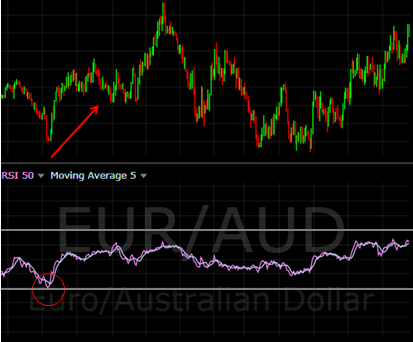
The range for the oscillator is from 0 to 100. When it drops below 30, it shows that the market is oversold, which is a buy signal. If the indicator goes above 70, it shows the market is overbought, which is a sell signal.
The basis for the calculation of the index is the ratio of up closes compared to down closes for historical prices. The formula for calculating the relative strength index:
RSI = 100 - 100 / (1+ RS*)
Where RS = Average of X days' up closes / Average of X days' down closes.
An example of the indicator being used is shown below.

The views and opinions expressed herein are the views and opinions of the author and do not necessarily reflect those of Nasdaq, Inc.