The market has seen its fair share of ups and downs in just the last couple of years. How do advisors quell client concerns while ensuring they “stay the course” amid volatility?
During volatile markets, clients turn to their advisors for clarity and guidance. To help advisors navigate these conversations, we put together The Top 10 Visuals for Clients & Prospects, a free slide deck filled with informative visuals that explain key investing concepts.
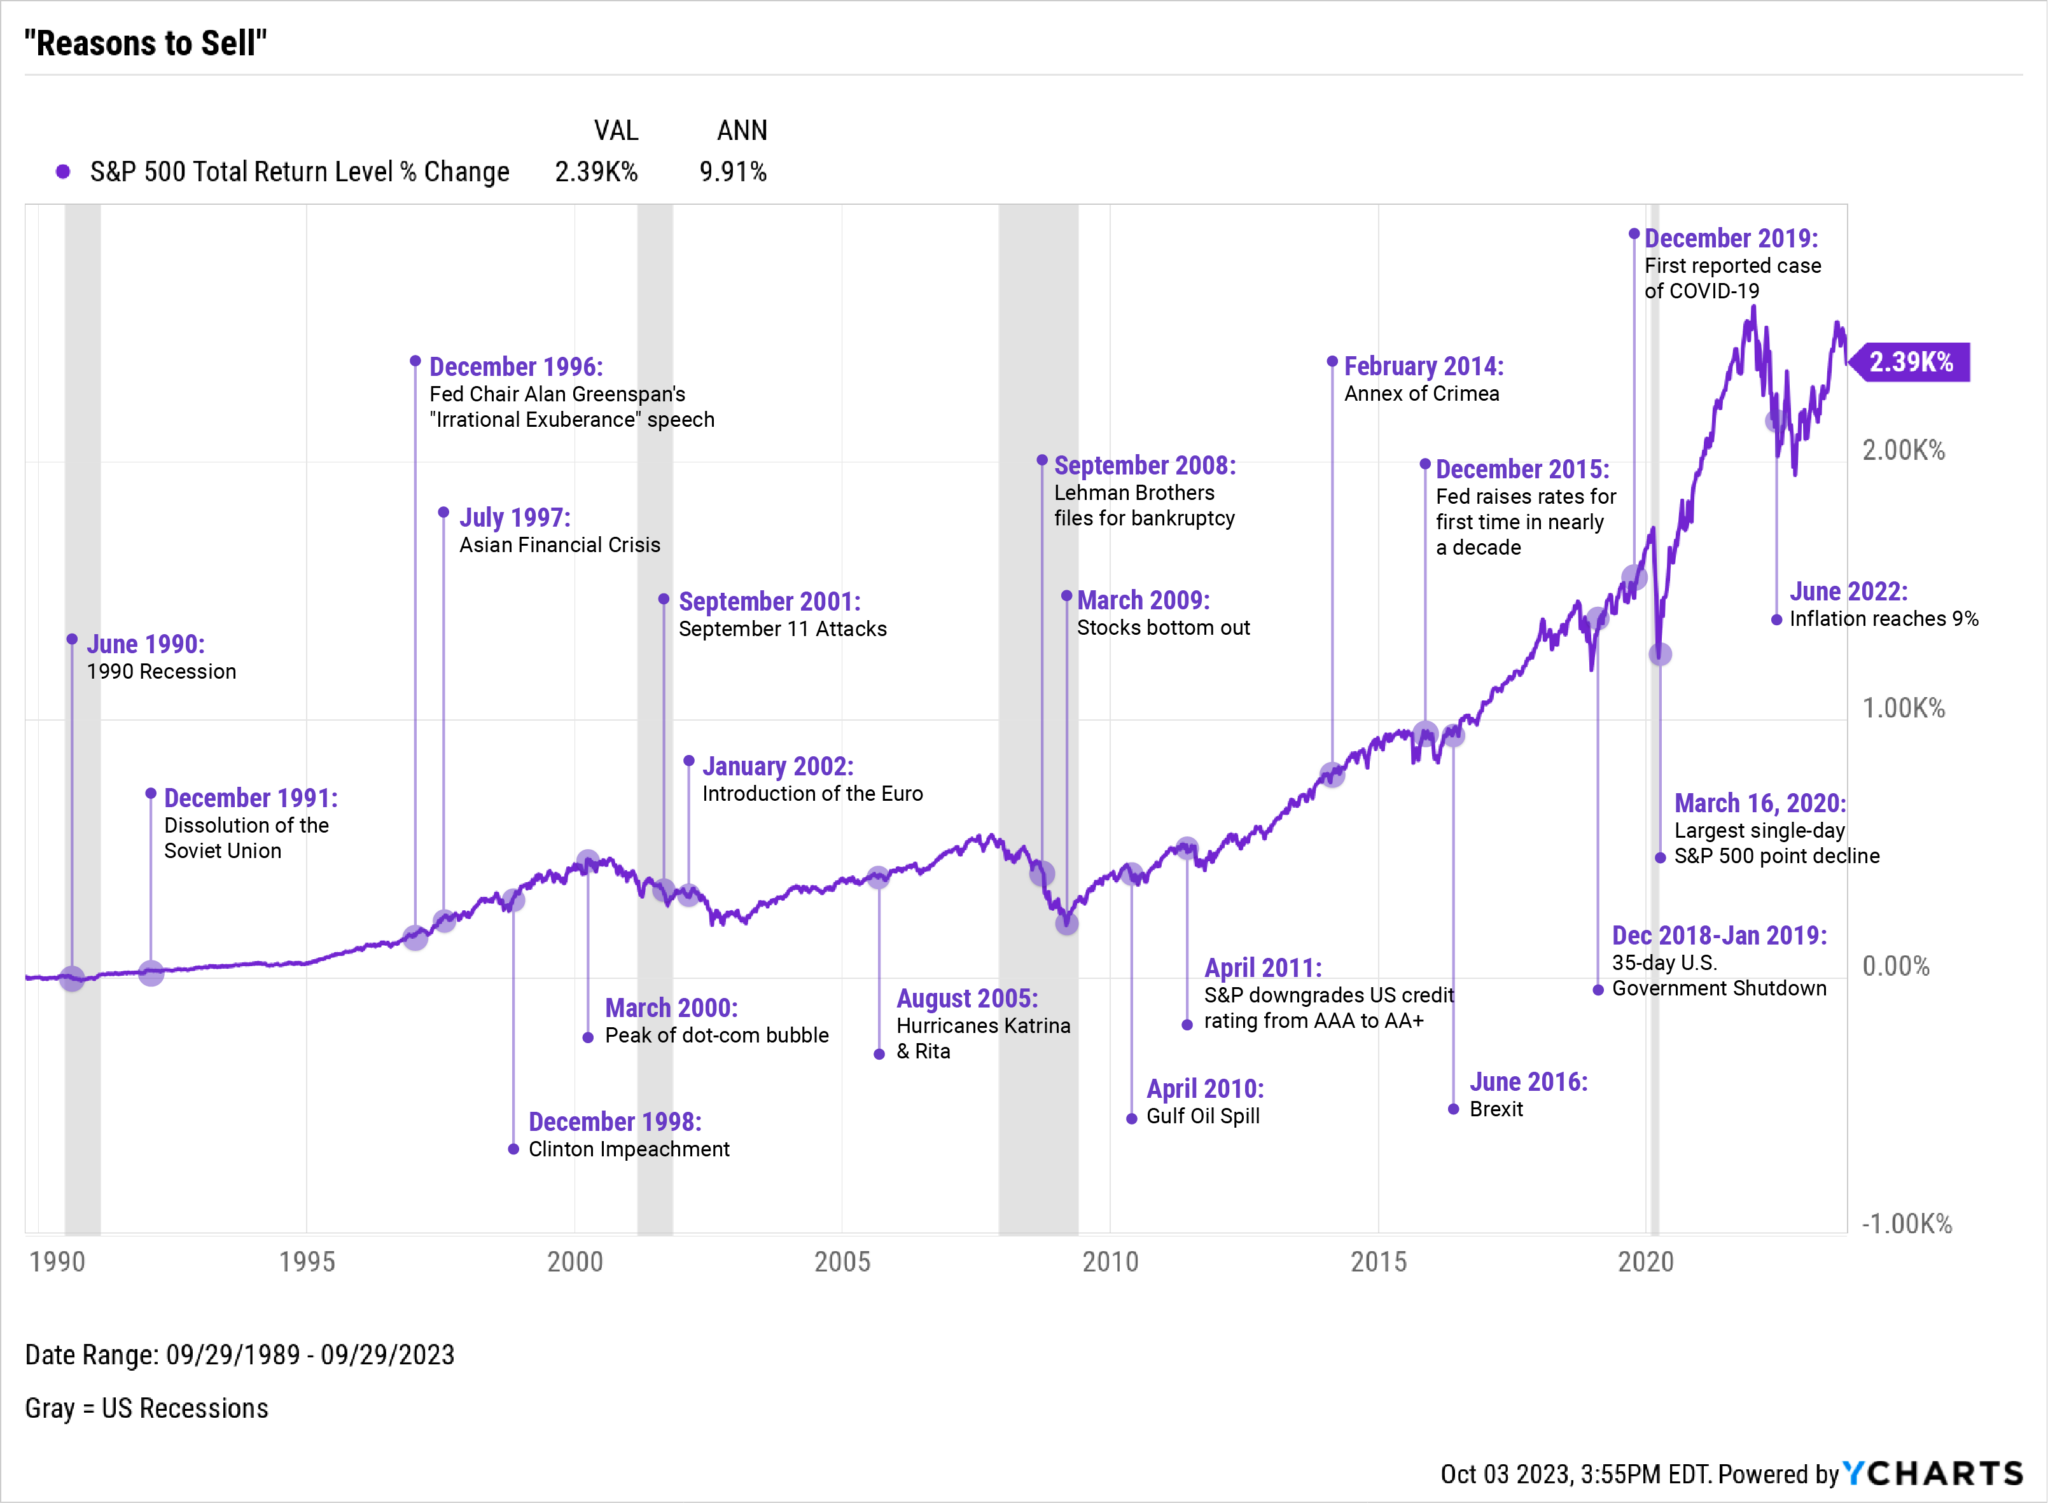
There’s Always a “Reason to Sell”. But Should You?
Since October 1989, the S&P 500 has posted a 2,100% total return (including dividends). Put differently, the index has grown an average of 9.73% each year for over 30 years. While there have been a number of events that have led to significant declines, the market continued to climb higher over time.
Download: The Top 10 Visuals for Clients and Prospects
Since October 1989, the S&P 500 has posted a 2,390% total return (including dividends). Put differently, the index has grown an average of 9.91% each year for over 30 years. While several events led to significant short-term declines, the market climbed higher.
During steep drawdowns, investors are thinking of one thing: capital preservation. Client emotions will run high with their life savings or retirement at stake. In these moments, advisors are in a unique position to address their clients’ concerns over the short term while reassuring them that they’re still on track to meet their long-term financial goals.
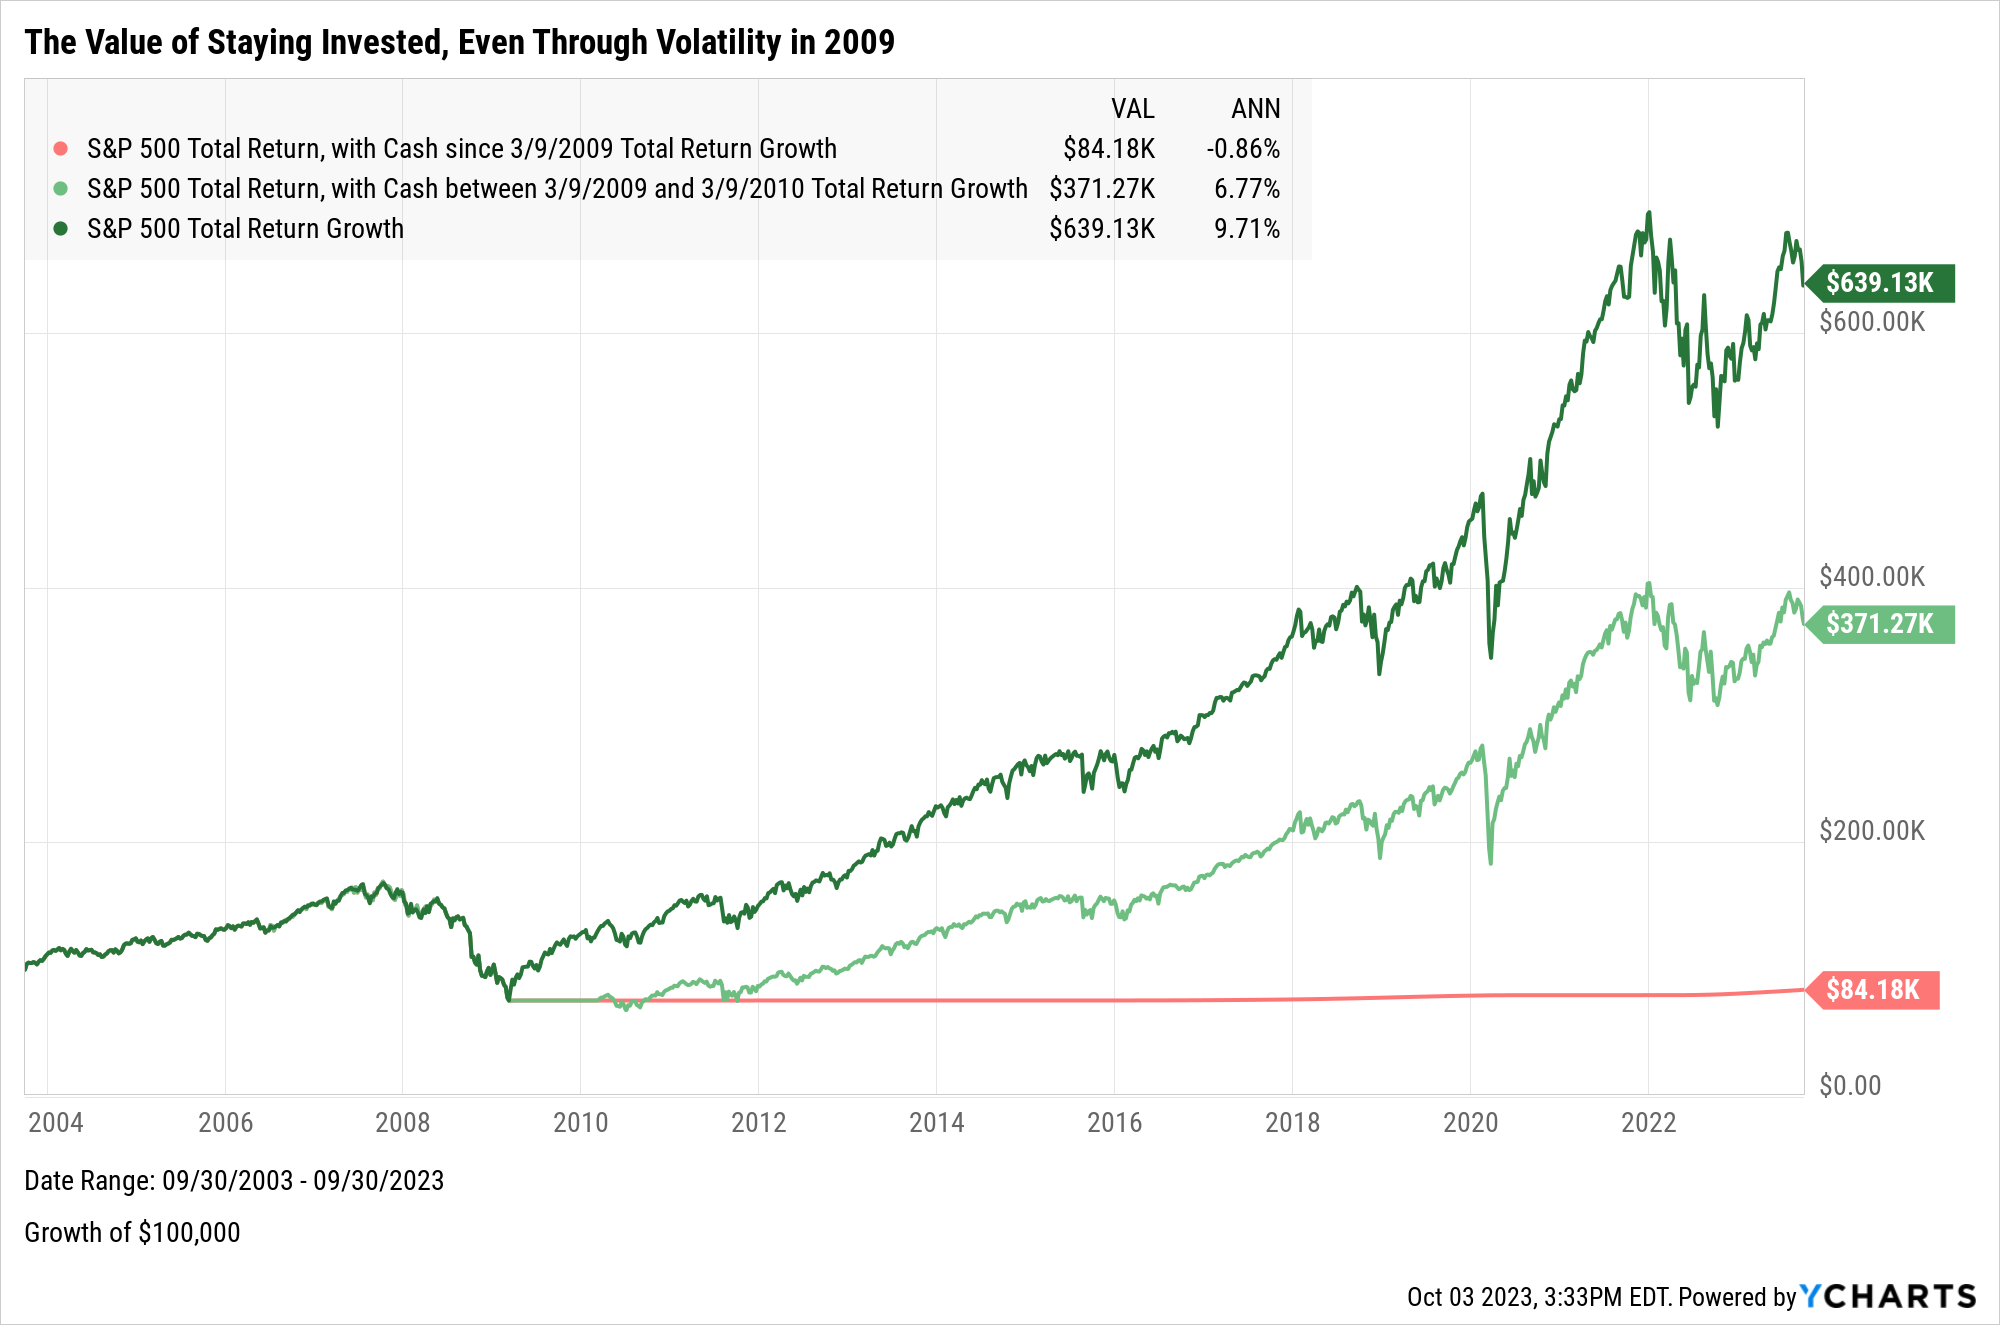
The Power of Staying Invested
Download: The Top 10 Visuals for Clients and Prospects
Using an initial investment of $100K in the S&P 500 since 2003 as an example, individuals who kept their money invested for 20 years saw a 9.71% annual rate of return compared to just 6.77% had they moved to cash for a year at the bottom of the 2008 Financial Crisis. Those who stayed in cash the whole time saw a negative return on their initial investment.
While investors may have felt good about the move, in retrospect, staying invested would have brought them closer to their long-term goals.
It’s natural for clients to want to minimize short-term losses. Volatile markets often spark challenging conversations for advisors. We built YCharts with powerful features like Scenario Builder and the beautiful visuals we used to create the charts in this post to help you exceed client expectations during volatile markets.
The views and opinions expressed herein are the views and opinions of the author and do not necessarily reflect those of Nasdaq, Inc.

YCharts
YCharts
YCharts combines comprehensive data with powerful tools and outstanding customer support to enable clients to develop and visually communicate unique insights, make smarter investment decisions, and save significant time. YCharts is the one-stop shop for equities, mutual funds, ETFs, economic indicators, and market data.
Read YCharts' Bio