
Natural Gas
 Daily Natural Gas
Natural gas futures are declining as the July contract nears expiration. The August contract also faces pressure due to weak LNG demand and increasing production. This bearish trend indicates a challenging market environment, with oversupply concerns dominating trader sentiment. Investors should watch for further price drops as the bearish outlook persists.
Natural gas futures are trading at $2.738, with resistance at $2.850 and support at $2.551. The RSI is at 51.63, indicating neutral momentum.
Prices are hovering above the 50-day moving average of $2.427, underpinning the uptrend. Traders should watch for a move above resistance for bullish signals or below support for bearish confirmation. A sustained move over $2.850 could attract momentum buyers, while a sharp break under $2.794 could trigger the start of a steep decline.
WTI Crude Oil
 Daily USOIL (WTI)
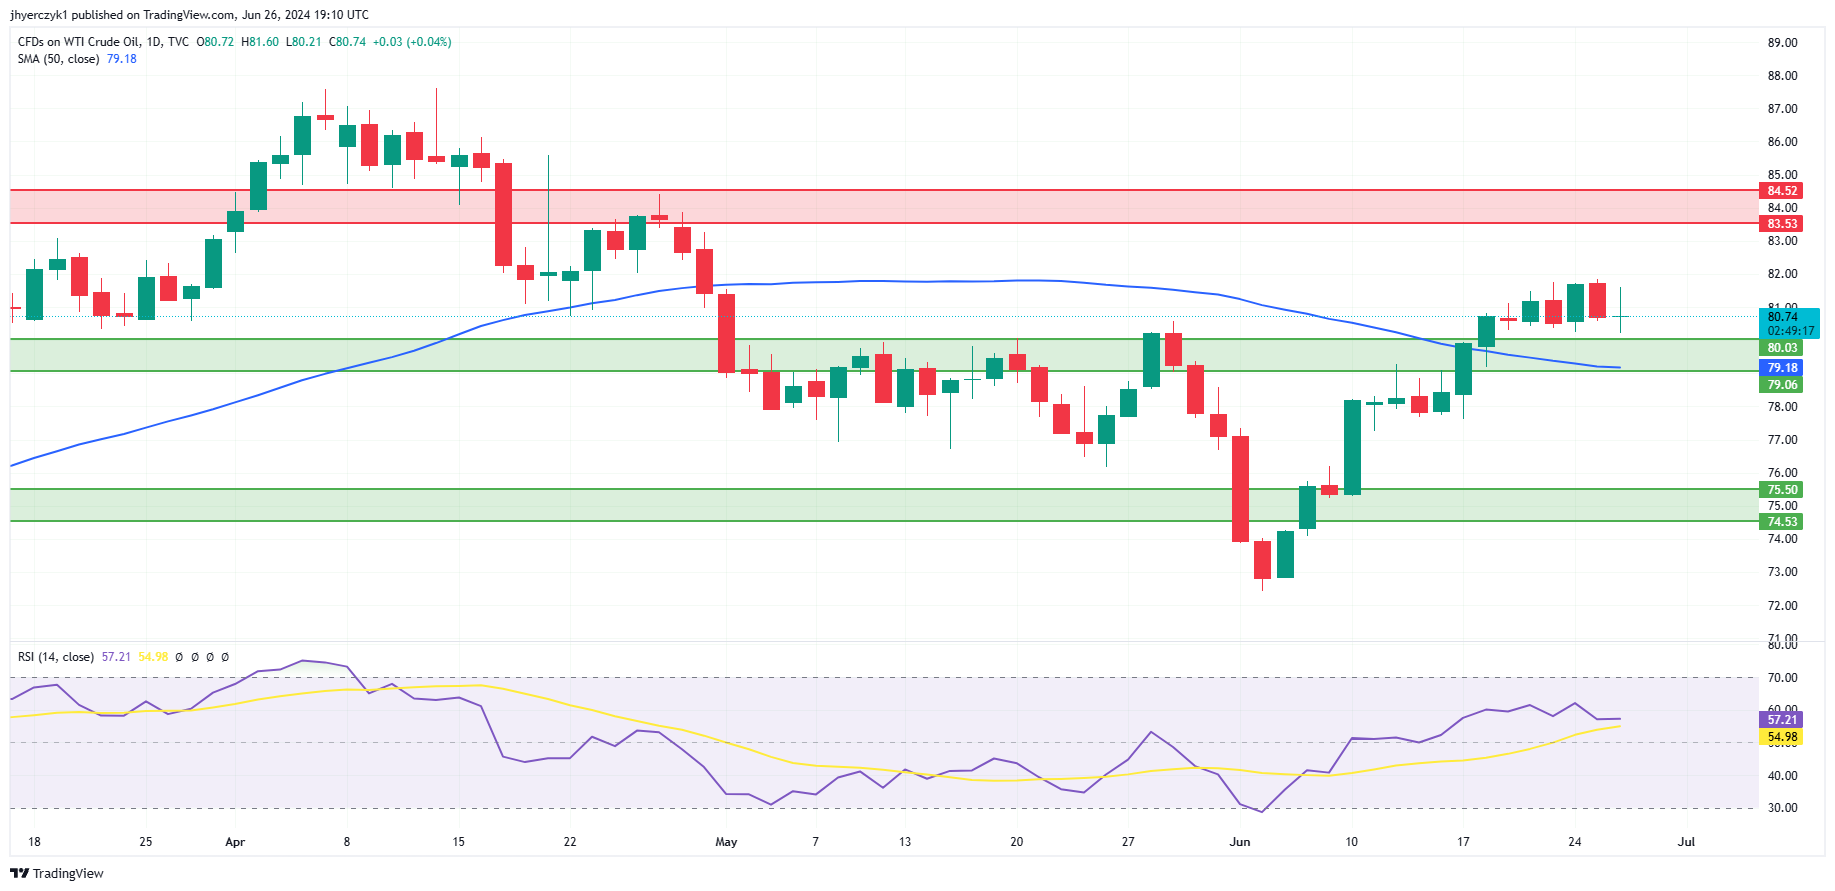
West Texas Intermediate (WTI) crude experienced a modest gain on Wednesday despite a surprise increase in U.S. gasoline supplies. The U.S. Energy Information Administration reported a 3.6 million barrel rise in crude stocks, contrary to analysts’ expectations of a drawdown. However, concerns about potential Middle East supply disruptions, due to escalating tensions between Israel and Hezbollah, helped support prices. Analysts noted that while U.S. stockpiles are increasing, global inventories are tightening, suggesting mixed market signals.
WTI crude oil is trading at $80.74, with minor resistance at $81.60 and support at $80.03 and $79.18. The Relative Strength Index (RSI) at 57.21 suggests moderate buying interest.
The market is trading on the strong side of the 50-day moving average at $81.52, indicating potential strength. Traders should monitor for a breakout above resistance or a drop below support for directional signals. An upside breakout would target $83.53.
Brent Crude Oil
 Daily Brent (UKOIL)
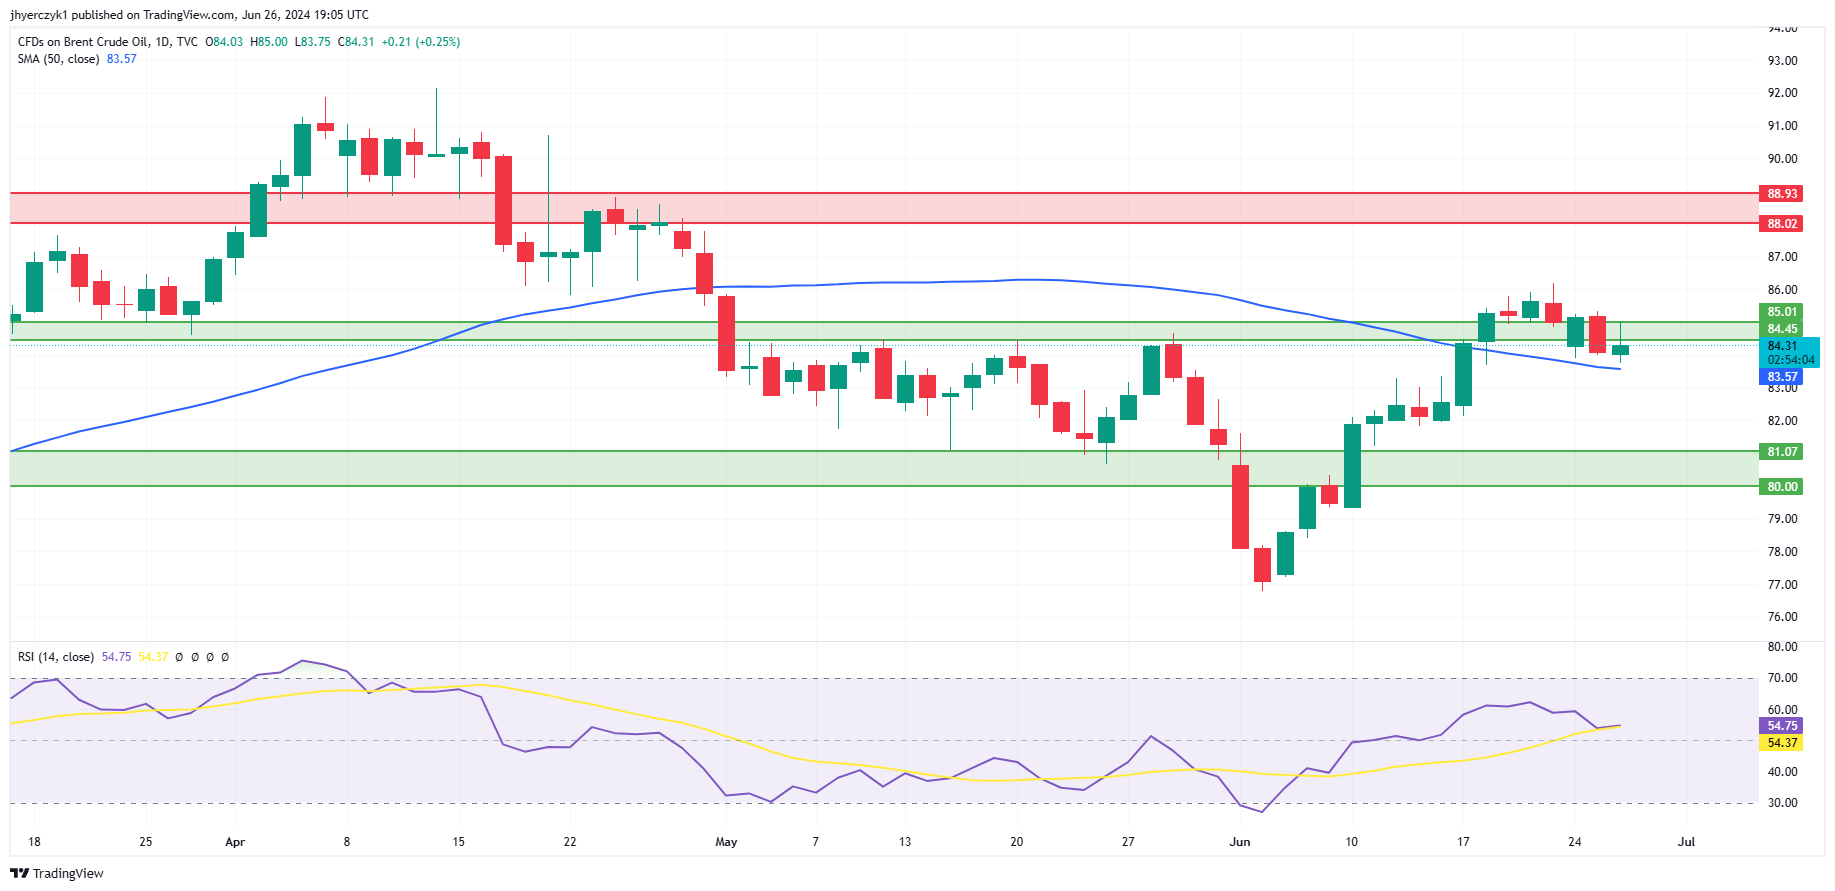
Brent crude performed better than WTI, bolstered by geopolitical risks in the Middle East. Cross-border tensions between Israel and Hezbollah, along with Houthi attacks on shipping in the Red Sea, have heightened fears of broader conflict involving major oil producer Iran. This geopolitical risk premium has driven Brent prices higher. Despite a jump in U.S. crude stocks, UBS analysts expect oil prices to rise in the coming weeks, supported by inventory draws in Japan and Europe, indicating a tighteningglobal market
Brent crude oil is trading at $84.31, with resistance at $85.01 and support at $83.57, the 50-day moving average. The Relative Strength Index (RSI) at 54.75 indicates moderate strength. Prices are fluctuating near the intermediate-term trend indicator, suggesting a potential consolidation phase. Traders should watch for a breakout above resistance or a dip below support for directional cues.
This article was originally posted on FX Empire
More From FXEMPIRE:
- Pepe Market Withstands 800B Token Selloff, Signaling Potential Bull Run in July
- Nasdaq 100, Dow Jones, S&P 500 News: Modest Gains for Tech Stocks as FedEx and Whirlpool Surge
- How Ethereum Could Rally to $5000+
The views and opinions expressed herein are the views and opinions of the author and do not necessarily reflect those of Nasdaq, Inc.

