
Market Overview
WTI crude oil prices remained steady at $77.98 per barrel in Asian trading on Monday as markets looked forward to the OPEC+ meeting on June 2, where producers will likely discuss extending output cuts.
Last week, WTI fell nearly 3%, and Brent crude dropped by 2% due to potential interest rate hikes indicated by the Federal Reserve. OPEC+ may extend voluntary cuts of 2.2 million barrels per day (bpd) into the year’s second half, totaling nearly 6% of global demand.
This stability and potential cuts positively influence the natural gas market by maintaining balanced supply and supporting prices amid anticipated summer demand.
Natural Gas Price Forecast
 Natural Gas (NG) Price Chart
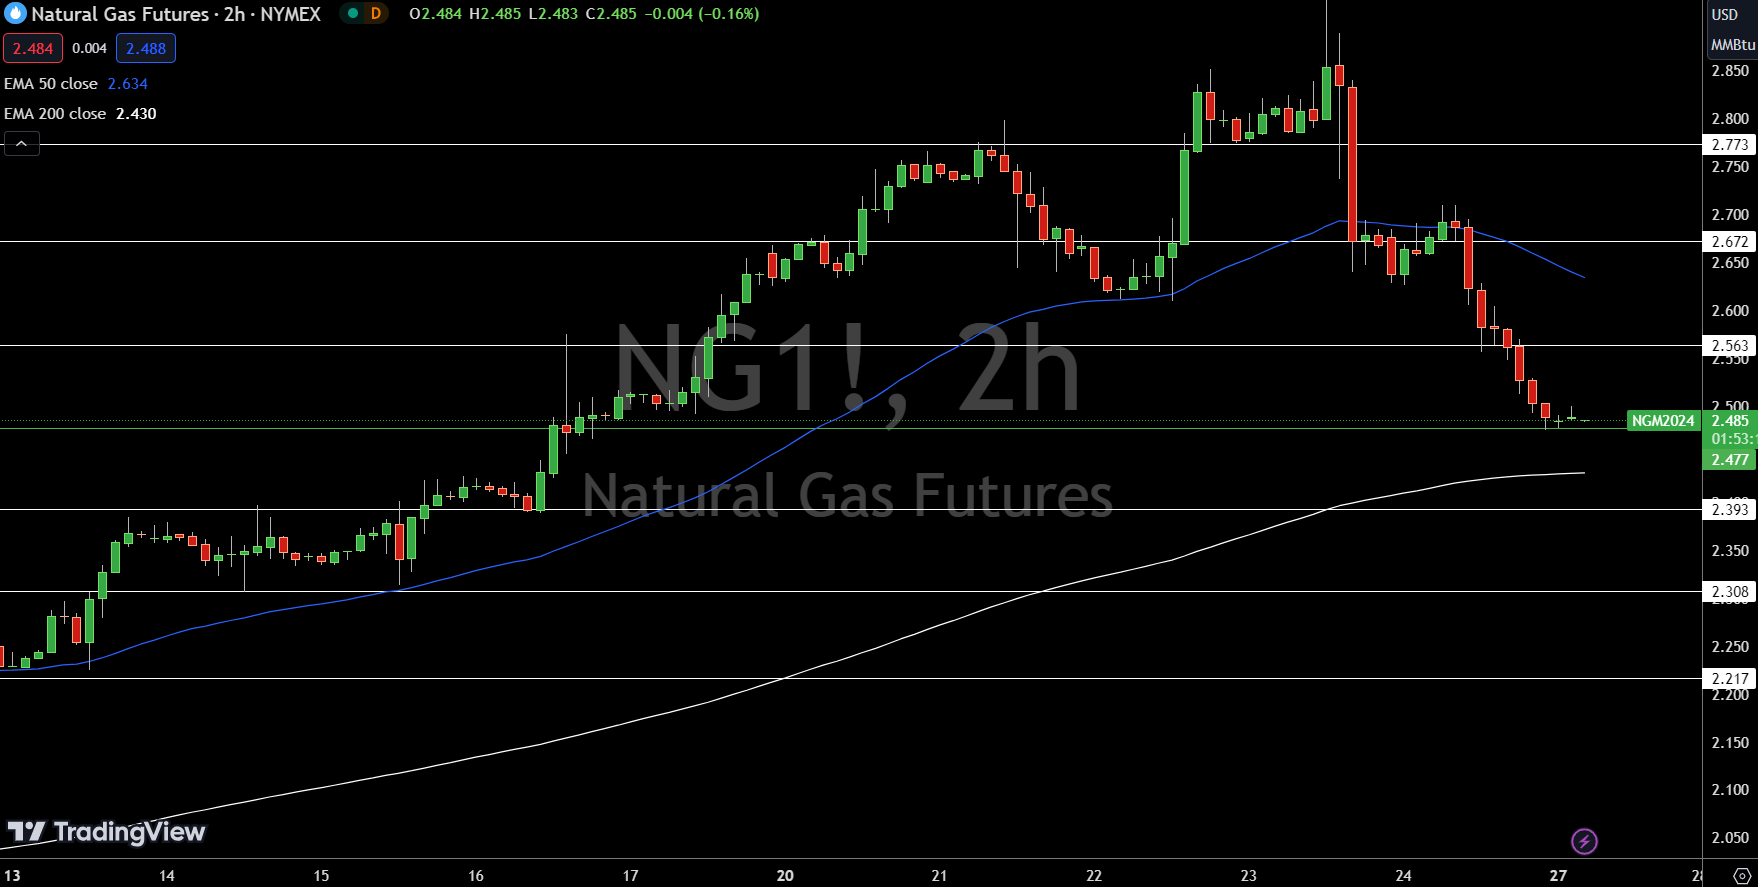
Natural Gas (NG) is trading at $2.485, up 0.40%. The pivot point is $2.48, a crucial level for market direction. Immediate resistance levels are $2.56, $2.67, and $2.77.
On the downside, support levels are $2.39, $2.31, and $2.22. The 50-day Exponential Moving Average (EMA) is $2.63, indicating a resistance level, while the 200-day EMA at $2.43 suggests significant support.
The outlook remains bullish above $2.48; however, a break below this level could trigger a sharp selling trend.
WTI Oil Price Forecast
 WTI Price Chart
USOIL is currently trading at $77.98, reflecting a 0.28% increase. The pivot point, marked at $77.58, is a critical level for determining market direction. Immediate resistance levels are $78.62, $79.28, and $80.04, while support levels are $77.13, $76.15, and $75.43.
The Relative Strength Index (RSI) stands at 58.00, indicating moderate bullish momentum. The 50-day Exponential Moving Average (EMA) is positioned at $77.69, and the 200-day EMA is at $78.87, suggesting mixed signals.
Overall, the outlook is bearish below the pivot point of $77.58, but a break above this level could boost bullish sentiment, whereas falling below could lead to increased selling pressure.
Brent Oil Price Forecast
 Brent Price Chart
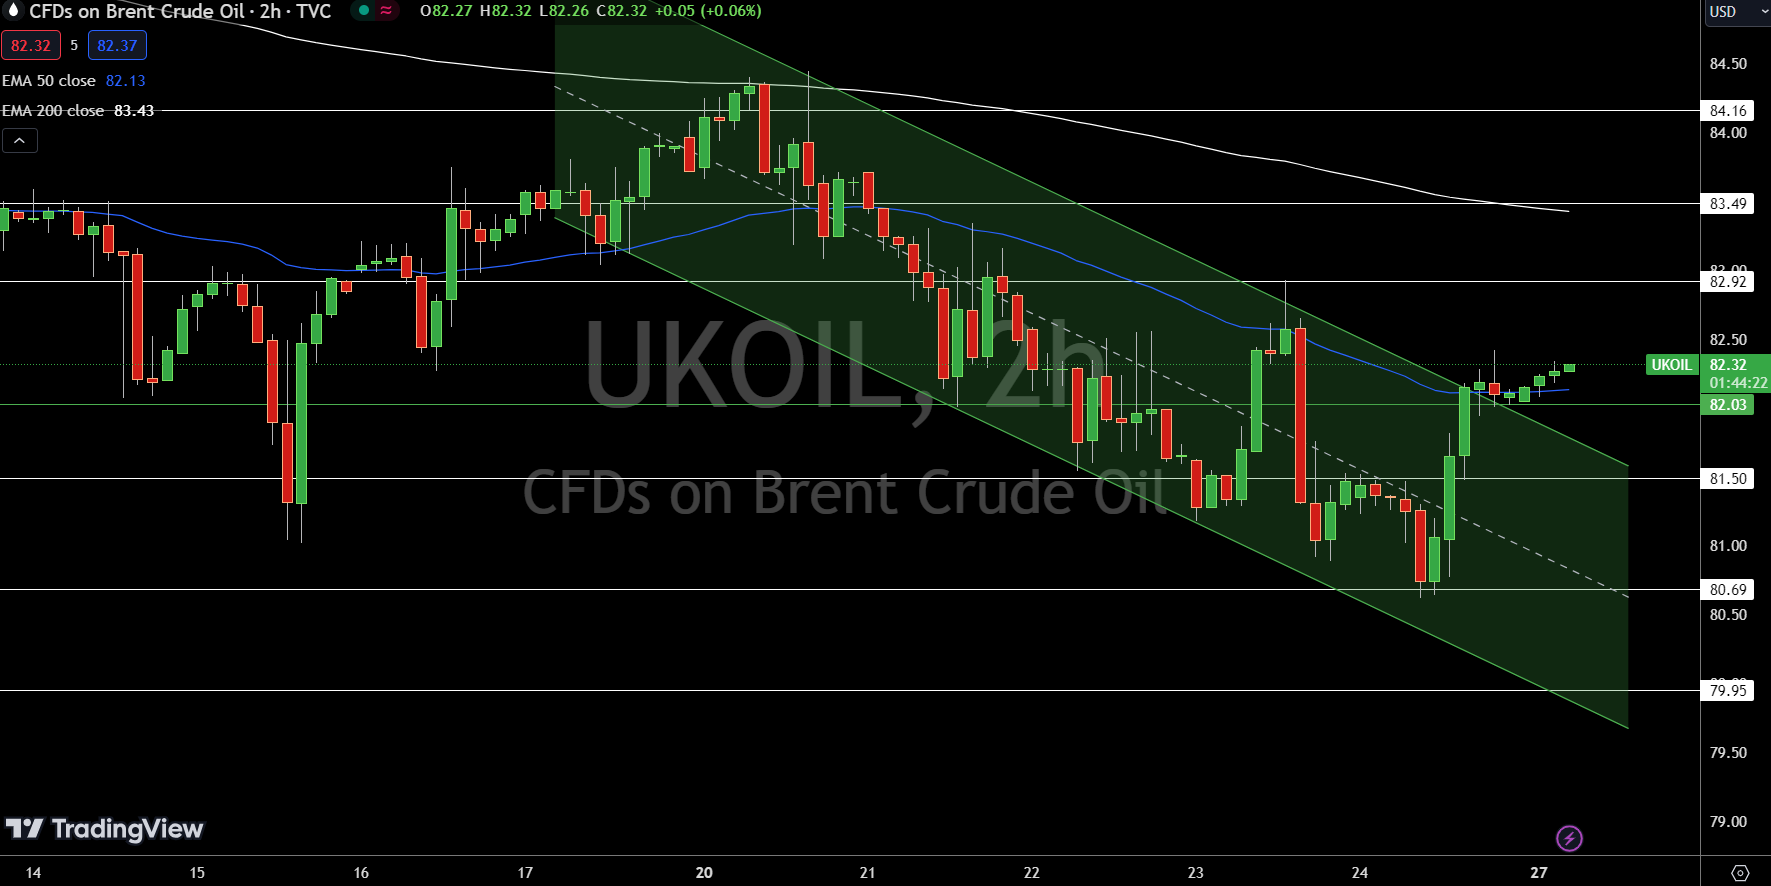
UKOIL is trading at $82.32, up 0.23%. The pivot point is set at $82.03, serving as a critical level. Immediate resistance levels are $82.92, $83.49, and $84.16. On the downside, support levels are $81.50, $80.69, and $79.95.
The 50-day Exponential Moving Average (EMA) is $82.13, indicating minor support, while the 200-day EMA is at $83.43, providing a significant resistance level. The outlook is bullish above $82.03; however, a break below this pivot point could trigger a sharp selling trend.
For a look at all of today’s economic events, check out our economic calendar.
This article was originally posted on FX Empire
More From FXEMPIRE:
- US Dollar (DXY) Index News: Greenback Steady as Traders Eye PCE Inflation Data
- NASDAQ 100 Price Forecast – NASDAQ 100 Continues to Look Positive Despite Holiday
- EUR/USD Forecast – Euro Continues to See Sideways Action
The views and opinions expressed herein are the views and opinions of the author and do not necessarily reflect those of Nasdaq, Inc.

