Nasdaq Index Performance: August 2023
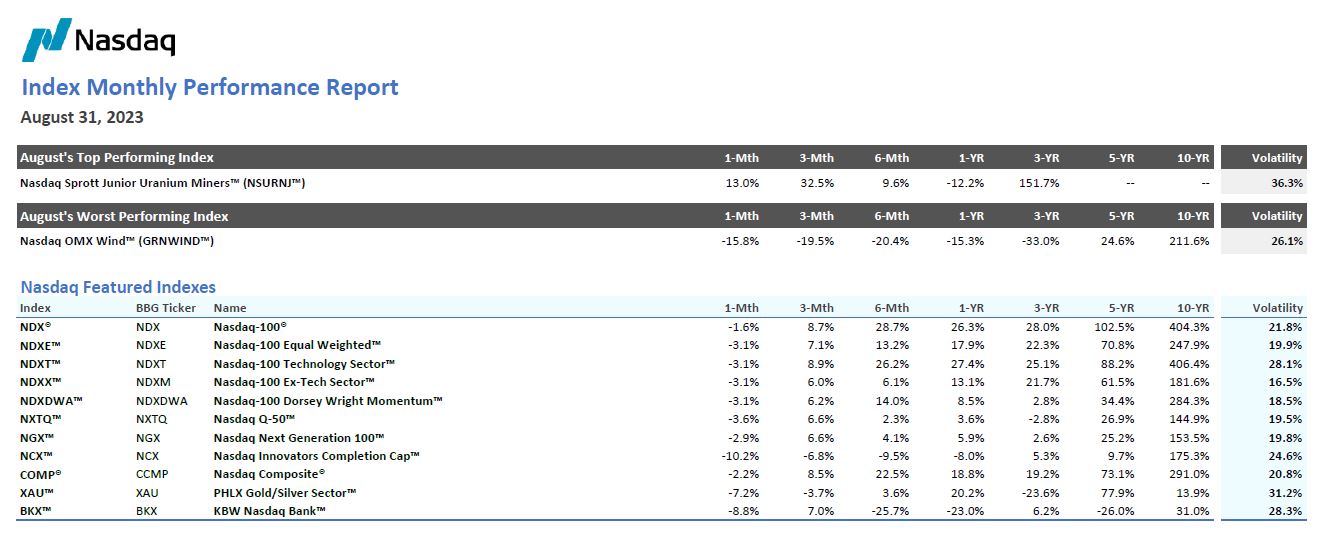
Performance was mostly negative for the month of August across the 107 indexes tracked in this report, as 93% finished in negative territory while the remaining 7% ended the month in the green. The average return across all 107 indexes was -4.0%, which was the worst average monthly performance since the start of the year. The Nasdaq-100® (NDX®) was down 1.6%, breaking its streak of five consecutive month of positive returns. The best-performing index was the Nasdaq Sprott Junior Uranium Miners™ (NSURNJ™), which gained 13.0%. On the other hand, the worst-performing index was the Nasdaq OMX Wind™ (GRNWIND™), as it fell 15.8%. Overall, there was weakness across all areas, with some of the steepest losses within the Nasdaq Crypto Indexes, Nasdaq Thematic ESG Indexes and Nasdaq Green Economy Indexes, while the Nasdaq Options Indexes and Nasdaq OMX Nordic Indexes registered generally more muted losses.
Within the Nasdaq Featured Index lineup, the Nasdaq-100® (NDX®) was the relative outperformer, down 1.6% while the Nasdaq Innovators Completion Cap™ (NCX™) was the relative underperformer, down 10.2%. The KBW Nasdaq Bank™ (BKX™) underperformed after two months of consecutive gains, registering losses of 8.8%. On average, the Nasdaq Featured Indexes registered average losses of 4.4%.
The Nasdaq US Large Cap™ (NQUSL™) was the relative outperformer of the nine Nasdaq Global Indexes, down 1.8%, while the second best outperformer, the Nasdaq Developed Markets™(NQDM™), was down 2.8%. The Nasdaq US Small Cap™ (NQUSS™) and Nasdaq Emerging Markets™ (NQEM™) were the relative underperformers, down 5.8% and 5.7% respectively. On average, the Nasdaq Global Index lineup lost 4.0%.
The Nasdaq OMX Nordic Index suite was down 1.4% on average. The OMX Nordic 40™(OMXN40™) was the only index that finished in positive territory, up 0.8%, and was one of seven indexes of the total 107 indexes that were up for the month. The laggard of the group was the OMX Copenhagen 25™ (OMXC25™), down 4.0%.
Artificial Intelligence which dominated within the suite of Nasdaq Thematic/Tech Indexes in July fell out of favor in August with the Nasdaq CTA Artificial Intelligence™(NQINTEL™), Nasdaq CTA Artificial Intelligence & Robotics™ (NQROBO™) and Nasdaq Global AI and Big Data™ (NYGBIG™) down 8.1%, 7.6% and 0.8% respectively. Four indexes within the suite registered positive returns, of which three indexes tracked cybersecurity. The Nasdaq Global Disruptive Tech™ (NYDTB™) was the top-performing across the suite, gaining 2.3%. The next best-performing index in August was the ISE Cyber Security UCITS™ (HUR™), followed by ISE Cyber Security™ (HXR™). The worst-performing index in the thematic lineup was the Nasdaq CTA Global Digital Health™ (BEWELL™), which fell 15.6%.
All but two indexes in the relative-strength driven suite of Nasdaq Dorsey Wright Indexes were down. The Dorsey Wright Energy Technical Leaders™ (DWEN™) and Dorsey Wright Consumer Staples Technical Leaders™ (DWCS™) were the sole outperformers, up 2.4% and 0.6% respectively. The Dorsey Wright Financial Technical Leaders™ (DWFN™) was the worst-performing of the 16 relative-strength-driven indexes with a loss of 6.6%. On average, the Nasdaq Dorsey Wright index suite declined 3.2% in August.
All but one of the Nasdaq Dividend and Income Indexes were down for the month of August. The Nasdaq US Dividend Achievers 50™ (DAY™) was the relative outperformer, up 2.7% while the Nasdaq International Dividend Achievers™ (DAT™) was the relative underperformer, down 4.5%. The Nasdaq Technology Dividend™ (NQ96DIVUS™) registered modest losses of 0.9% for the month.
The Nasdaq Options Suite finished in the red with an average loss of 1.0% and was a relative bright spot with average losses well below the average losses of the rest of the suite of indexes. The Credit Suisse Nasdaq WTI Crude Oil FLOWS106 TR™ (QUSOITR™) was the relative outperformer of the group and was the only index within the suite which registered positive returns of 2.4%.
The suite of Nasdaq Thematic ESG Indexes posted average losses of 5.8%. The Nasdaq Sprott Junior Uranium Miners™ (NSURNJ™) was the relative outperformer and the only index which posted positive returns, registering gains of 13.0%. The Nasdaq Clean Edge Green Energy™ (CELS™) was the relative underperformer, registering losses of 12.9%.
The Nasdaq Green Economy Indexes also registered average losses of 5.8%. The Nasdaq OMX Wind™ (GRNWIND™) was the relative underperformer, down 15.8% while the Nasdaq OMX US Water™ (GRNWATUSL™) was the relative outperformer, down 1.4%.
Finally, all four of the Nasdaq Crypto Indexes posted declines, registering an average loss of 10%. The worst-performing of the group was the Nasdaq Ethereum™ (NQETHS™), down 10.9%, while the best-performing of the group was the Nasdaq Crypto Index Europe™ (NCEIS™) down 8.3%.
The Nasdaq-100 snapped its five-month streak of gains, posting losses of 1.6%, its worst performance since the beginning of the year. In a month that has historically been difficult for the markets, investors exercised caution as they contended with higher bond yields, ongoing problems in China and uncertainty surrounding both the economy and monetary policy. The first half of the month saw Treasury yields rise to a 16-year high on elevated rate fears, weighing on rate-sensitive technology stocks and the broader market. The month ended with the much-anticipated meeting at Jackson Hole Symposium where the Federal Reserve Chairman Powell maintained a hawkish tone. As for how long this sell-off will continue, it remains quite uncertain. On a rolling one-year basis, the Nasdaq-100 is up 26.3%.
Disclaimer:
Nasdaq® is a registered trademark of Nasdaq, Inc. The information contained above is provided for informational and educational purposes only, and nothing contained herein should be construed as investment advice, either on behalf of a particular security or an overall investment strategy. Neither Nasdaq, Inc. nor any of its affiliates makes any recommendation to buy or sell any security or any representation about the financial condition of any company. Statements regarding Nasdaq-listed companies or Nasdaq proprietary indexes are not guarantees of future performance. Actual results may differ materially from those expressed or implied. Past performance is not indicative of future results. Investors should undertake their own due diligence and carefully evaluate companies before investing. ADVICE FROM A SECURITIES PROFESSIONAL IS STRONGLY ADVISED.
© 2023. Nasdaq, Inc. All Rights Reserved.
The views and opinions expressed herein are the views and opinions of the author and do not necessarily reflect those of Nasdaq, Inc.

Nasdaq Index Research Team
Nasdaq
Nasdaq calculates more than 40,000 diverse indexes, providing coverage across asset classes, countries and sectors.
Read Nasdaq Index Research Team's Bio