Welcome back to the Monthly Market Wrap from YCharts, where we break down the most important market trends for advisors and their clients every month. As always, feel free to download and share any visuals with clients and colleagues, or on social media.
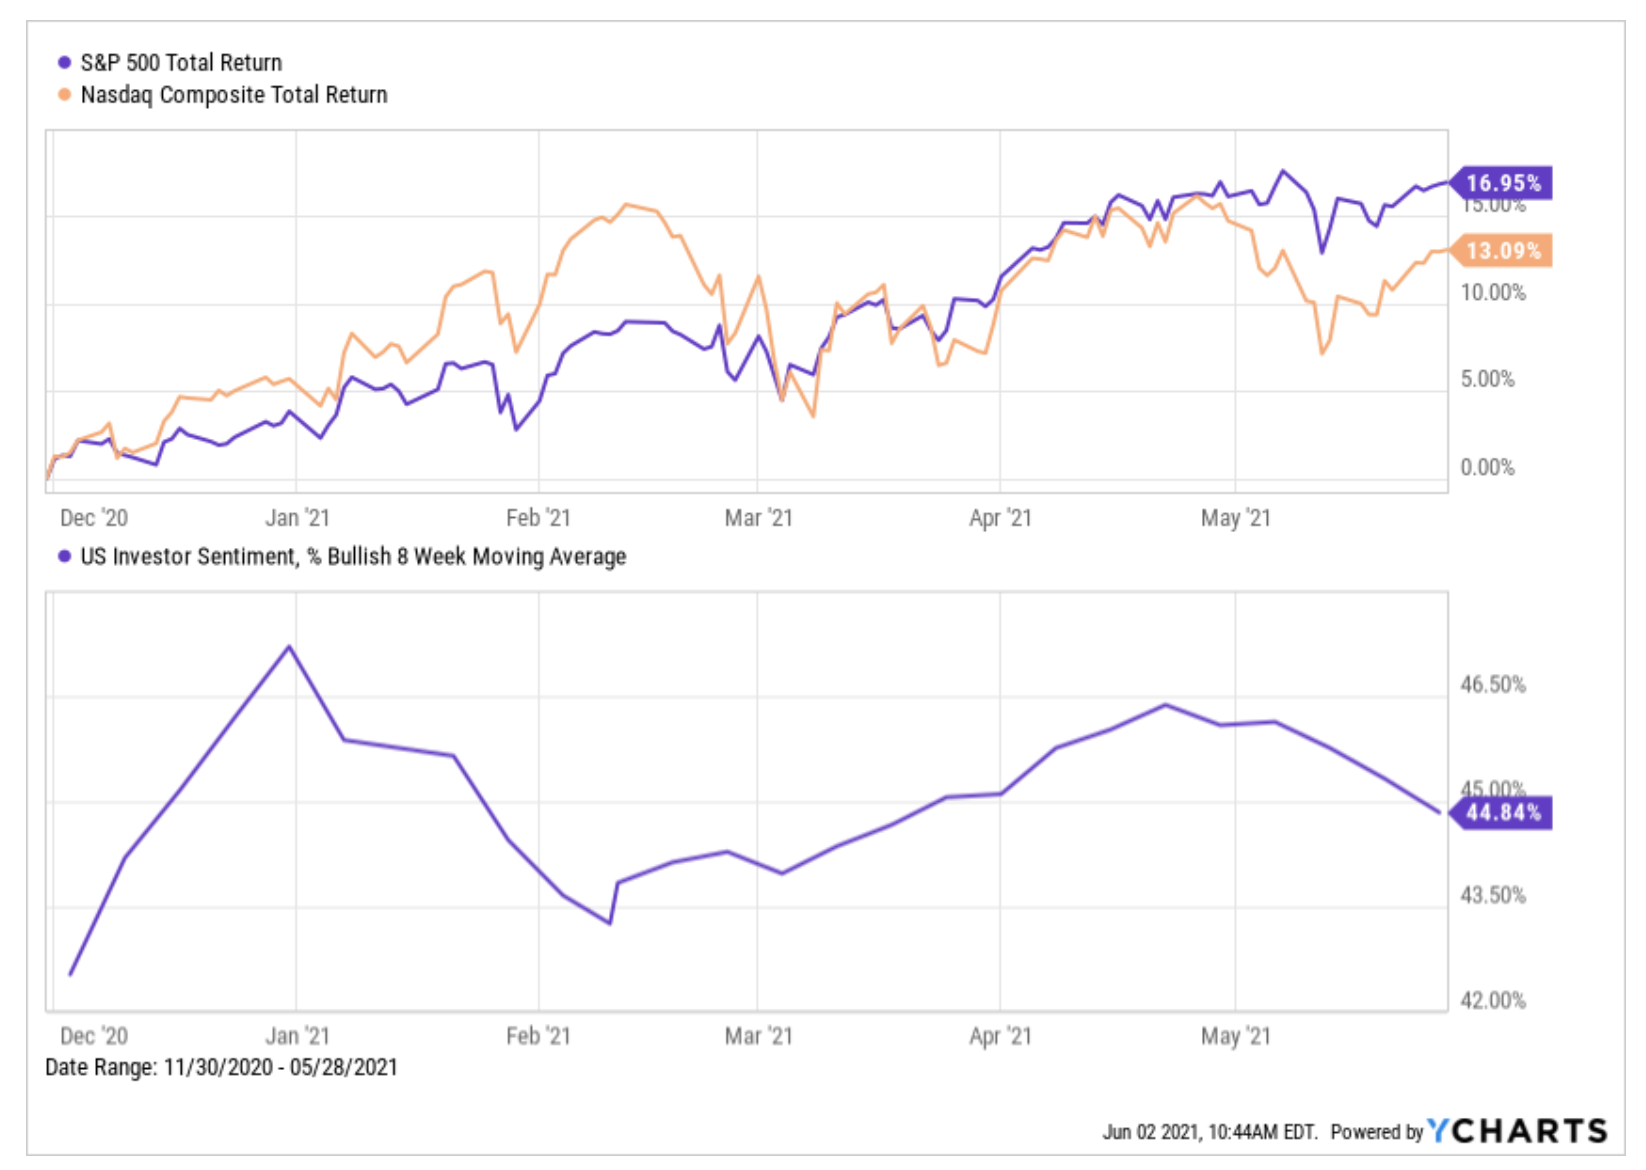
Every May brings about the old Wall Street adage: “Sell in May and Go Away”. May also rekindles the debate on whether the saying has any merit. This year, it turns out some investors did sell in May, as the NASDAQ drew down as much as 6.6% while the S&P 500 dropped nearly 4% off its previous high. The selling led to a decline in the percentage of US investors who are feeling bullish in May as well.
Also in May, the US population reached a 40% full COVID-19 vaccination rate. As countries further ramp up their vaccine rollouts, reopening stocks have been on the rise, as are expectations for a lively #Summer2021.
The second quarter of 2021 is in full swing, with summer on the horizon and these key developments occurring in May:
• Off the YCharts! Crypto: Inflating Inflation
• Major Index Returns: Ex-US Outperforms
• Sector Movement: 8 out of 11 Winners in May
• Hot Stocks of the Month: Oil, Steel, Gold Lead the Way
• Laggards & Losers: Consumer Cyclical, Technology Dive
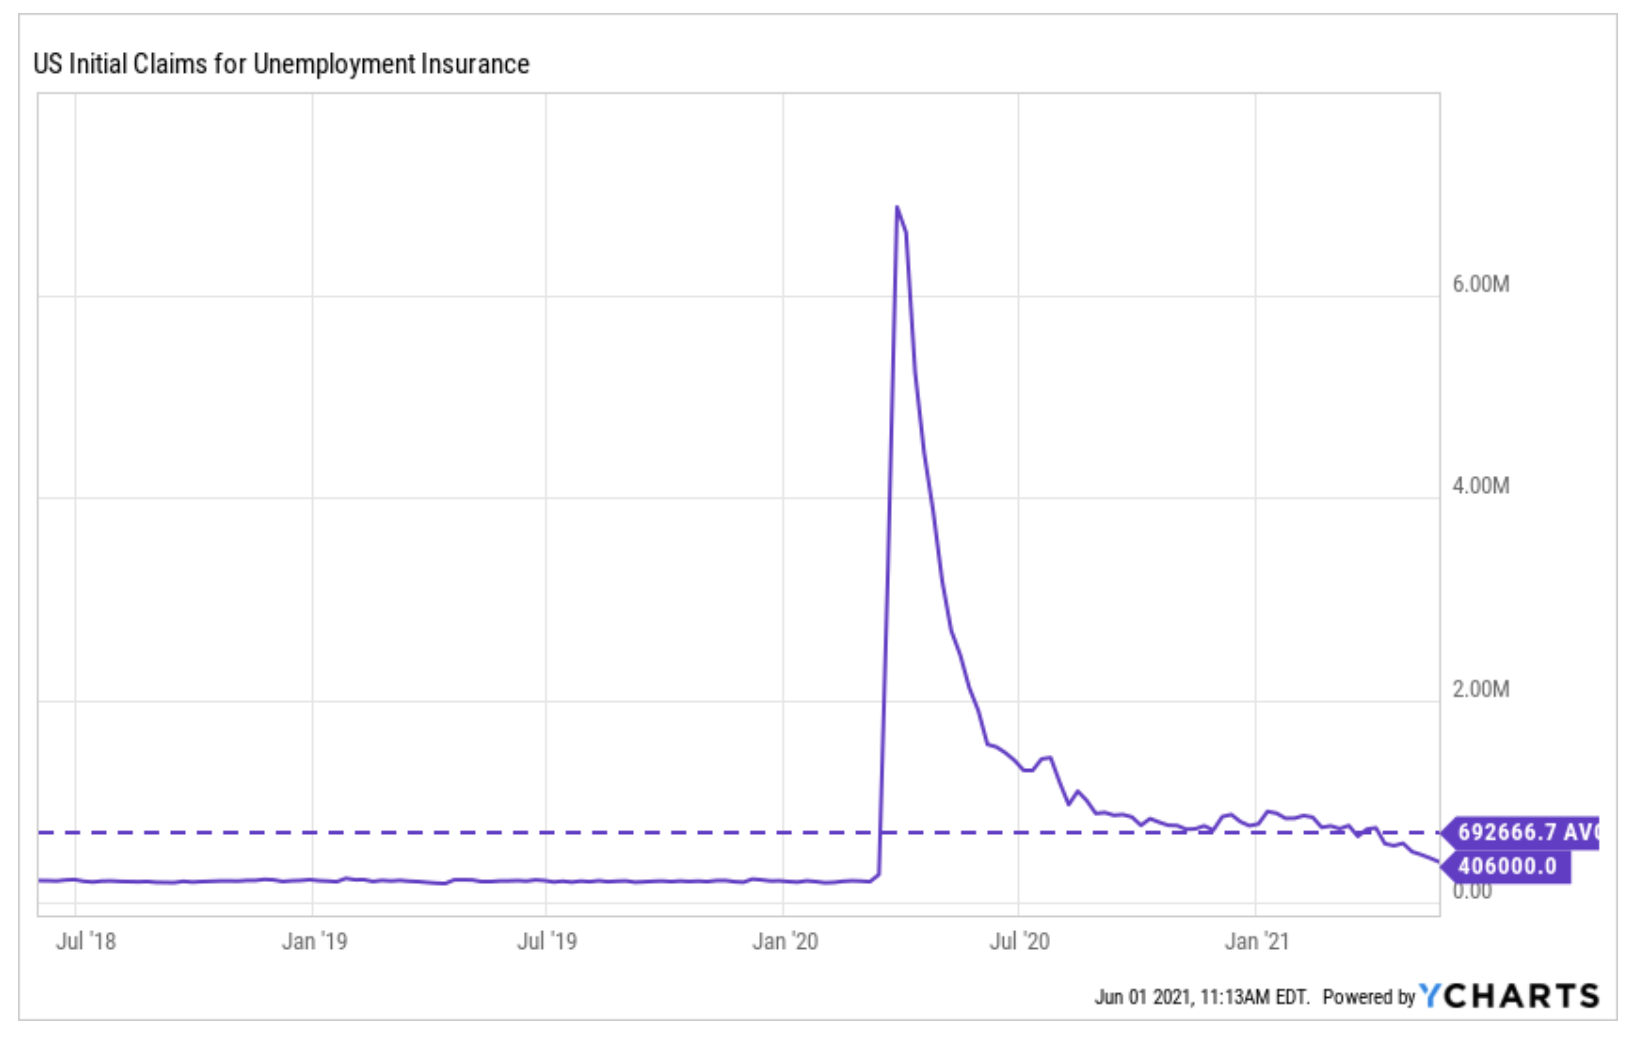
• Economic Data: Initial Jobless Claims Plummet, Housing Takes a Breather
Off the YCharts! Crypto: Inflating Inflation
“To the moon” has been the popular battlecry as of late, referring to runaway growth in meme stocks and cryptos. Unfortunately for consumers, prices on many goods are also “mooning”. The US Inflation Rate has soared to levels not seen for a decade, and notable consumer goods such as Lumber and Wood Products, US Retail Gas, and Passenger Car Rentals are skyrocketing in price. If you’re building a home or planning a road trip, your wallet may be hit even harder than usual.

Download Visual | Modify in YCharts
Major Index Returns: Ex-US Outperforms

Download Visual | Modify in YCharts
Investors had mixed feelings about selling in May and going away. The S&P 500 ticked up 0.7%, while the NASDAQ shed 1.4%. Though US markets ended their May on the 28th in observance of Memorial Day, international exchanges were business as usual — Developed Markets gained 3.4% in May, while Emerging Markets used the extra day to finish the month up 2.3%. The Global Aggregate Bond Index and high yield corporate bonds rose 0.9% and 0.3%, respectively.
Sector Movement: 8 out of 11 Winners in May

Download Visual | Modify in YCharts
Eight of the 11 US equity sectors posted positive gains in May. After a modest gain last month, Energy led the way with a 5.7% increase. Materials and Financials were in a close second and third, at 5.1% and 4.8%, respectively. The three losers in May were Technology, Utilities, and Consumer Discretionary, all of which had a more difficult time recovering from the marketwide correction during mid-May.
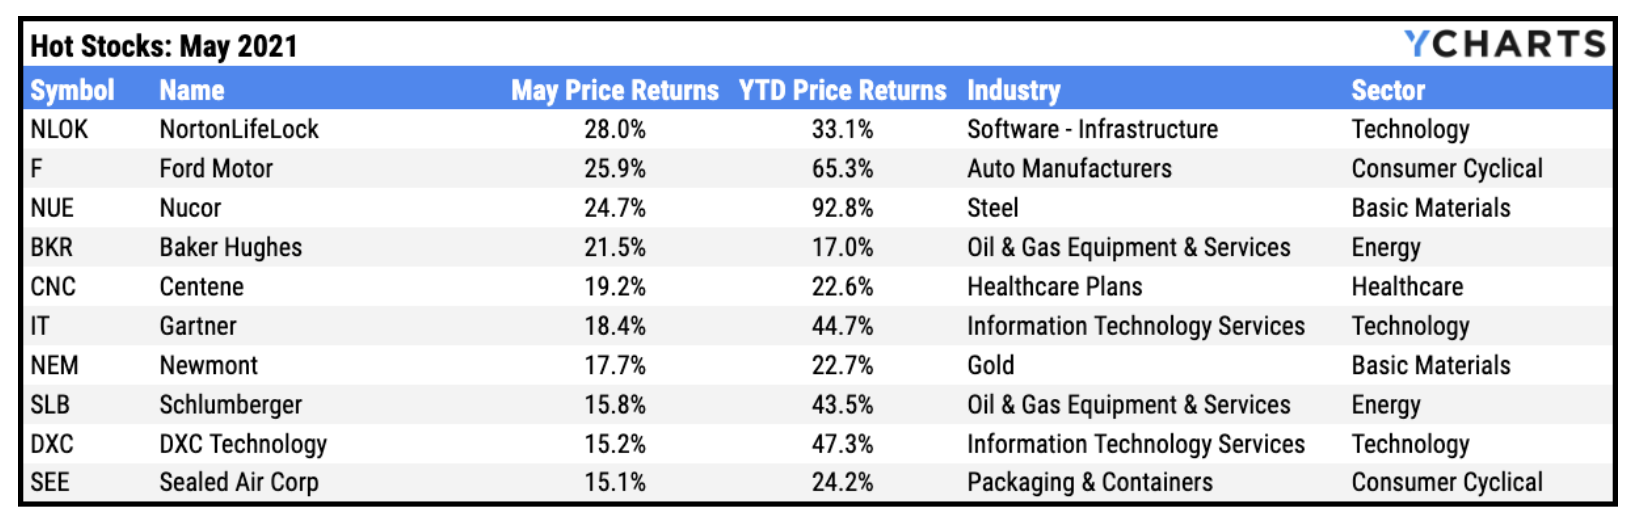
Hot Stocks of the Month: Oil, Steel, Gold Lead the Way
Download Visual | Modify in YCharts
A picture-perfect combination including an earnings beat, raised guidance, and multiple analyst upgrades helped crown NortonLifeLock (NLOK) as May’s top S&P 500 performer. As both economic activity and inflation pick back up, basic materials and energy stocks have benefited from rising commodity prices, most notably Baker Hughes (BKR), Schlumberger (SLB), Nucor (NUE), and Newmont (NEM).
Ford Motor (F), Centene (CNC), Gartner (IT), DXC Technology (DXC), and Sealed Air Corp (SEE) also made the cut for May’s hot stocks.
Laggards & Losers: Consumer Cyclical, Technology Dive
Download Visual | Modify in YCharts
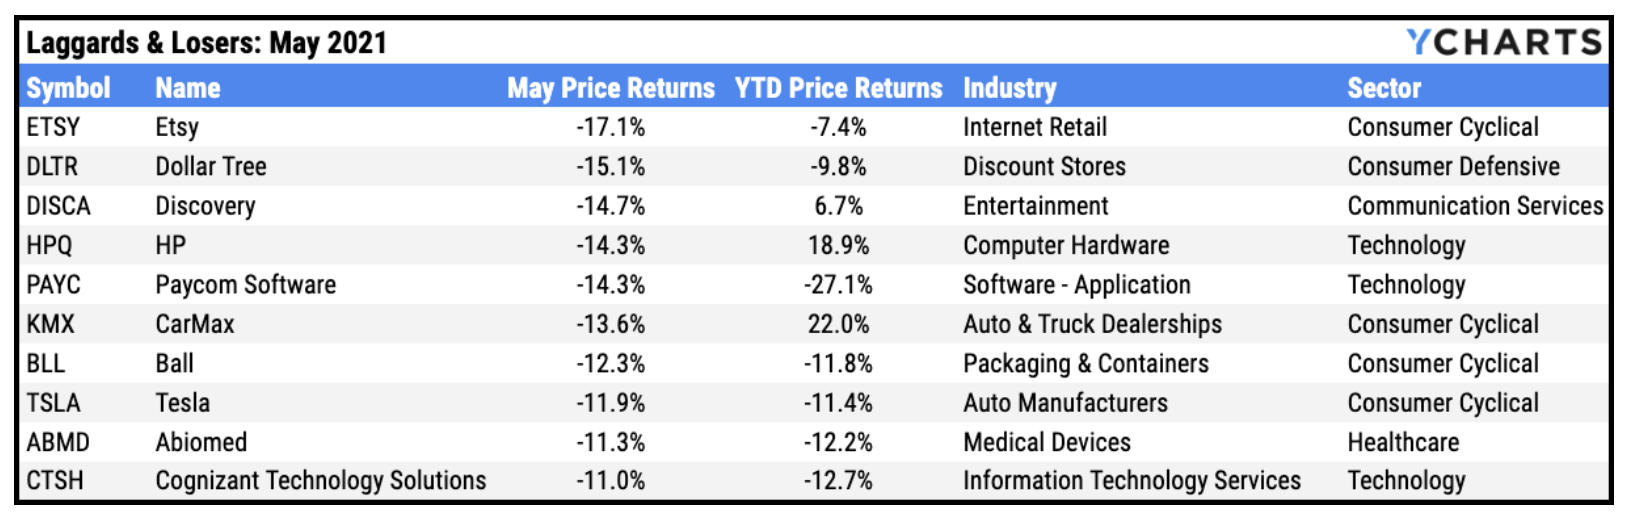
Shares of consumer companies Etsy (ETSY), Dollar Tree (DLTR), CarMax (KMX), and Ball (BLL) all fell in May on disappointing earnings and guidance. Tesla (TSLA) continued its decline amid new entrants to the EV market, confusion surrounding the alleged sales of Bitcoin assets, and a report that the average Tesla sale price is down by 10% year-over-year.
A special shout-out is due to Discovery (DISCA) for making our ‘Laggards & Losers’ list for not the first, not second, but third straight month. In May, DISCA fell on news that it will merge with AT&T’s (T) WarnerMedia, and due to a recently announced investigation into fiduciary duty breaches by Discovery’s board of directors. HP (HPQ), Paycom Software (PAYC), Abiomed (ABMD), and Cognizant Technology Solutions (CTSH) round out May’s ten worst performers.
Financial Market & Advisor News
Highest Number of S&P 500 Companies Citing “Inflation” on Q1 Earnings Calls in Over 10 Years (FactSet)
New on YCharts: FINRA Reviewed Portfolio Reports (YCharts)
Bets against S&P 500 ETF jump to highest this year (InvestmentNews)
Fidelity Saw New Accounts and Trading Soar in First Quarter (WealthManagement.com)
5 Things Advisors Should Know About Grayscale Bitcoin Trust (YCharts)
Euro Area Inflation Rate Hits 2% for First Time Since 2018 (Bloomberg)
Economic Data: Initial Jobless Claims Plummet, Housing Takes a Breather
Employment
April’s unemployment rate clocked in at 6.1%, a 0.1% uptick from March. Initial jobless claims continued plummeting throughout May to 406,000 as of May 22nd, setting fresh record lows for the post-pandemic era.
Download Visual | Modify in YCharts
Production and Sales
US Retail and Food Services Sales were flat in April, though durable goods orders slipped 1.3% in April, marking the third straight down month in a row (after data adjustments).
Housing
After a booming rebound in March, US New Single Family Houses Sold dropped by 5.9% in April. Existing Home Months’ Supply ticked up 30 basis points to 2.4, the highest level since October 2020, and the US house price index rose 1.4% in April, also its largest gain since October 2020.
Consumers
Prices and spending saw another month of consistent growth. The US Consumer Price Index rose 0.8% in April, while consumer spending (PCE) was up by 0.6%.
This article was originally published on YCharts.com.
The views and opinions expressed herein are the views and opinions of the author and do not necessarily reflect those of Nasdaq, Inc.
Other Topics
Stocks
YCharts
YCharts
YCharts combines comprehensive data with powerful tools and outstanding customer support to enable clients to develop and visually communicate unique insights, make smarter investment decisions, and save significant time. YCharts is the one-stop shop for equities, mutual funds, ETFs, economic indicators, and market data.
Read YCharts' Bio