News & Insights


Executive summary:
- Major indices trade to all-time highs
- Corporate earnings growth was better than expected
- Economic data shows signs of disinflation, though not yet at the Fed’s target
- U.S. GDP was revised down
- Market breadth is diverging
Index performance for May:

May was a strong month for equity indices, with all the major benchmarks finishing higher.
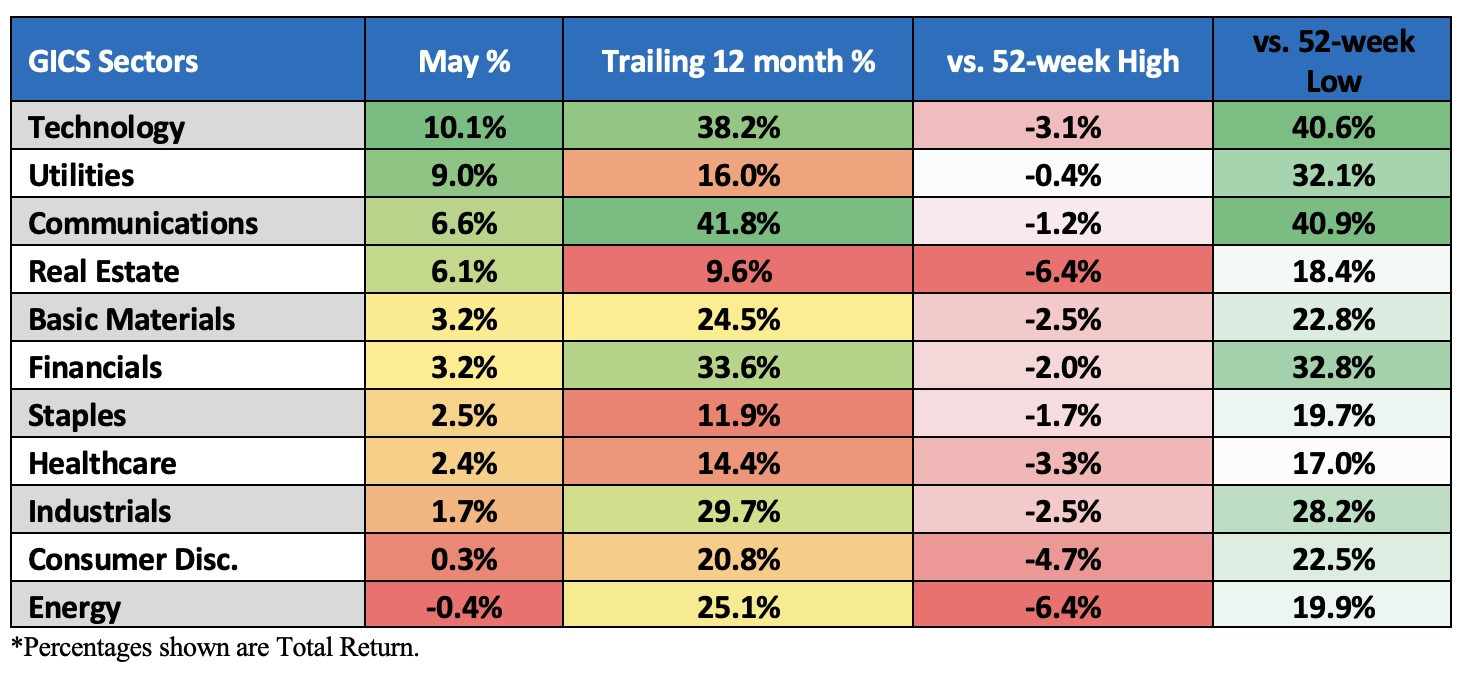
The Nasdaq, Dow and S&P 500 notched new all-time highs during the month as ten of the eleven major GIC sectors ended the month positive. The Tech sector gained 10% while Utilities added 9%, both on the back of the AI trade and strong earnings. Energy declined 0.4% on falling oil prices while Consumer Discretionary eked out a modest 0.3% gain as consumer spending concerns were highlighted on multiple corporate earnings calls.
Accordingly, Growth outperformed Value in May. The Russell 1000 Growth Index gained 6% for the month, while the Russell 1000 Value Index gained 3.6%. The Nasdaq 100 Index, heavily weighted in the tech space, gained 7% in May and has gained nearly 30% since October.
More than half of May’s S&P 500’s gains can be attributed to four mega tech stocks (Nvidia +26%, Apple +13%, Microsoft +6.8% and Alphabet +6%). Despite the index’s positive May performance, less than half of the S&P members now trade above their 50-day simple moving average, which leads to a bigger question of market leadership and breadth divergence.
Beyond corporate earnings, markets remained focused on economic data, particularly signs of (or lack of) disinflation, geo-politics and of course the Fed.
Economic data released in May was somewhat softer than expected. GDP weakened to +1.3%, April’s core PCE price index was +2.8%, and the April jobs reports posted weaker job creation numbers and lower wage growth, while the unemployment rate held at 3.9% (near a 50-year low). Retail sales were weaker than expected, leading to concerns of slowing consumer spend, as highlighted on numerous corporate earnings calls. April’s CPI report was a little soft as the shelter category weakened. Many economists expect disinflation to continue for the rest of the year.
There was plenty of Fed speak to contend with this month following the May FOMC meeting and the release of the minutes later in the month. Although the minutes could be interpreted as somewhat hawkish (recall the minutes were discussing March’s data, which showed stickier than expected inflation), Chairman Powell suggested the disinflation narrative may need more time to play out as the committee reviews data and gains confidence that inflation is moving closer towards the 2% target.
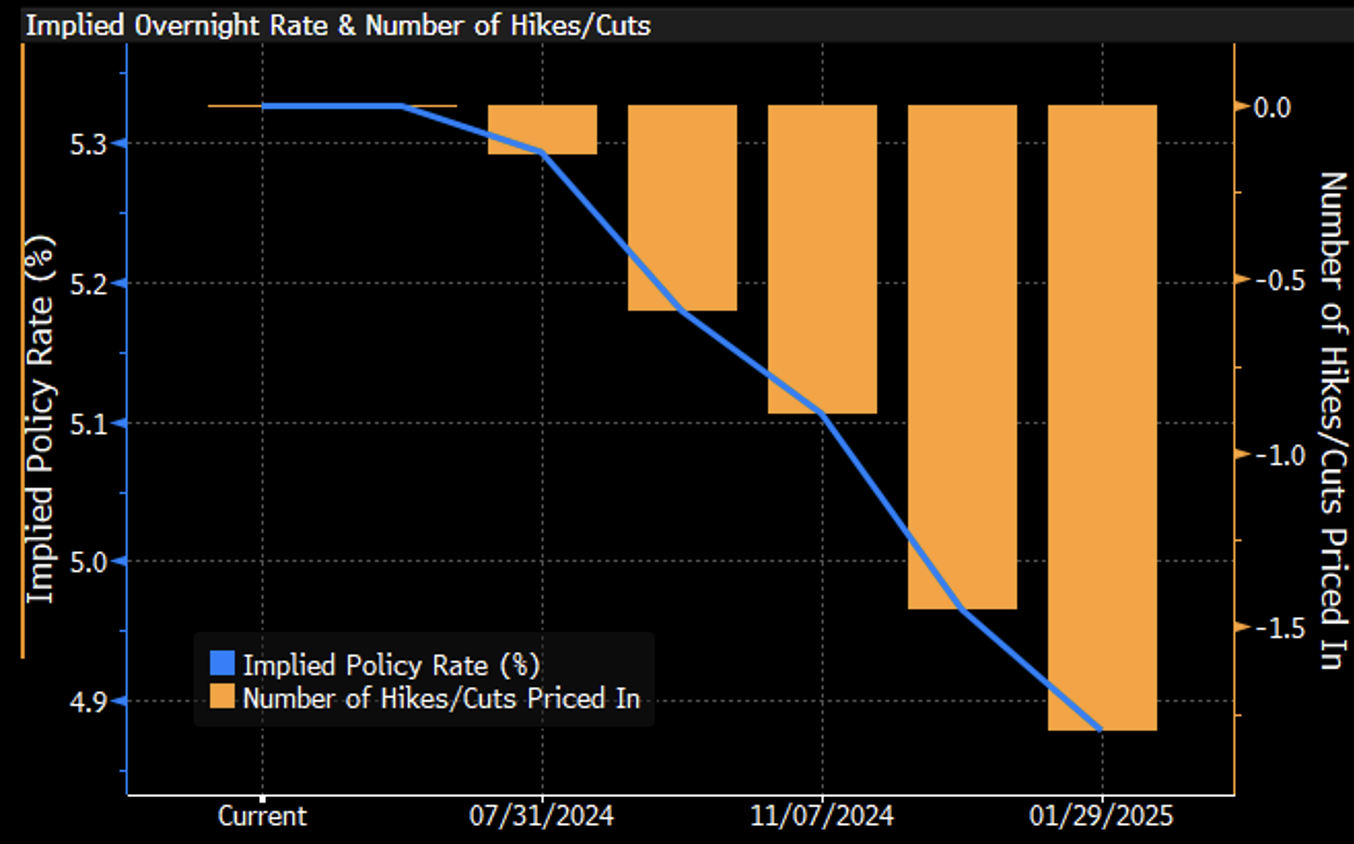
Fed Fund Futures are now pricing in a 60% chance of a rate cut at the September FOMC meeting.
Sector performance total return for May:
Rate hike odds suggest a hold for the summer FOMC meetings with one possible cut by year-end:
Earnings commentary:
S&P 500 corporate earnings for Q1’24 were good, as 78% of the members beat EPS estimates. According to FactSet data, the blended growth rate for the index was 5.9%, besting consensus of +3.4%. The Communications Services sector posted the highest earnings growth rate of any of the 11 S&P sectors at +34%. Earnings beats were +7.4%, which is below the five-year average (+8.5) but higher than the 10-year average (+6.7%). Reported revenue beats and positive earnings surprises also ran below the medium and longer-term averages. If you strip out the “Magnificent 7” stocks, the blended earnings growth rate for the remainder of the S&P 500 is a negative 1.80%, raising concerns of breadth divergence.
Interestingly, FactSet pointed out that 191 S&P 500 companies mentioned “AI” on their earnings calls.
Economic commentary:
The U.S. Department of Labor’s May 5th Employment Situation Report for April posted worse-than-expected numbers on job creation (+175,000 new vs. +240,000 consensus), a lower unemployment rate (+3.9% vs. 4% consensus) and lower hourly wage growth (+0.2% vs. 0.3%). The labor force participation rate remained steady at 62.7%.
April’s headline CPI was cooler than expected at +0.3% M/M (consensus +0.4%) and up 3.4% Y/Y compared to 3.5% in March. Core CPI, which excludes food and energy, also went up 0.3% M/M (in line with consensus) and up 3.6% Y/Y vs +3.8% in March. The report showed some disinflation in Shelter (+0.4%), which has recently been one of the largestcontributors to the increase in total CPI and core CPI. The market viewed the report positively, as there were no upside surprises.
PPI surprisingly increased last month. April’s PPI increased 0.5% (consensus +0.3%), though March’s PPI was revised to -0.1% from +0.2%. April Core PPI rose +0.5% (above consensus but also following a negatively revised March). Total PPI Y/Y increased 2.2% vs +2.1% in March. Ex-food and energy, PPI was up 3.1% versus +2.8% in March.
Retail sales (which do not adjust for inflation) were flat in April (consensus was +0.4%), which is consistent with a cooling economy and ties in with the updates we have heard on corporate earnings calls. Ex-autos, retail sales increased 0.2%, in line with the consensus. The retail sales control group (which flows into GDP) missed consensus and fell -0.1%.
U.S. Initial Jobless Claims remain relatively low and consistent with a tight labor market. For the week ending May 25, new claims were 219,000 (consensus 217,000), slightly below the four-week average. Continuing jobless claims increased slightly to 1.791 million from a revised 1.787 million.
The U.S. Department of Commerce released a downwardly revised estimate for Q1 GDP. The second estimate numbers showed the economy grew by 1.3% annually (the prior estimate was +1.6%) on a slowdown in consumer spending, exports and government spending. The GDP Chain Deflator (price index) was revised down to +2.4% from +2.5%.
Personal income increased 0.3% in April (in-line with consensus) while personal spending increased 0.2% below consensus of +0.3%. Real personal spending declined in April by -0.1% below consensus of +0.1%.
The PCE Price Index was up 2.7% Y/Y, in line with consensus. Core PCE Price Index, which excludes food and energy, rose 2.8%, also in line with consensus. On a monthly basis, the PCE deflator rose 0.3% while core increased 0.2%, also in line with consensus.
The Conference Board’s Consumer Confidence Index rose in May to 102 (consensus was 96) from an upwardly revised 97.5 in April. The Expectations Index (based on consumers’ short-term outlook for income, business and labor market conditions) rose to 74.6 from 68.8 but is still below the 80 level, which signals a recession.
CPI Inflation – YoY:

Treasuries:
Treasuries were mostly firmer across the curve in May. Yield on the benchmark U.S.10-year Treasury fell 3.87% and now sits at 4.50%. Shorter term 2s fell 3.23%, yielding 4.87%. The 10yr/2yr maturity curve has remained inverted for nearly two years now.
10-Year Treasury Constant Maturity Minus 2-Year Treasury Constant Maturity:

Oil:
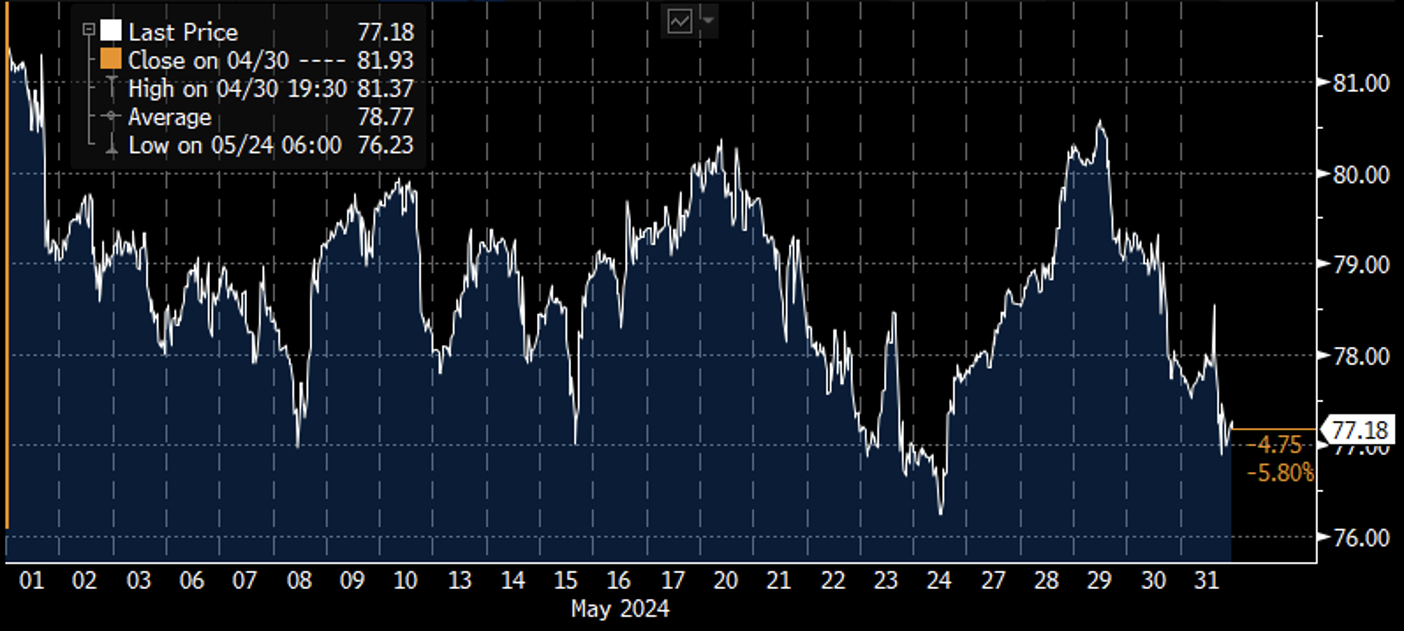
Oil futures declined for the second consecutive month, falling by 6% in May.
Crude Oil front month contract for May:
Dollar:
The dollar declined 1.5% in May after advancing for four consecutive months.

Looking ahead:
There will be many market catalysts in June. On the economic calendar, the May Jobs report will be released Friday morning (6/8). Economists are expecting the unemployment rate to remain unchanged at 3.9%. CPI will be released on June 12, followed by PPI on June 13. The FOMC rate decision is on June 12; Fed Fund Futures are pricing in a hold for this meeting. On June 21, we have “triple witch” options expiration and S&P Index rebalancing. Finally, on June 28, at the close, we have the annual Russell Reconstitution, which is traditionally one of the highest equity volume days of the year.
The information contained herein is provided for informational and educational purposes only, and nothing contained herein should be construed as investment advice, either on behalf of a particular security or an overall investment strategy. All information contained herein is obtained by Nasdaq from sources believed by Nasdaq to be accurate and reliable. However, all information is provided “as is” without warranty of any kind. ADVICE FROM A SECURITIES PROFESSIONAL IS STRONGLY ADVISED.
Latest articles

This data feed is not available at this time.
Data is currently not available