
This morning, June’s CPI data came in lower than markets expected, especially core.
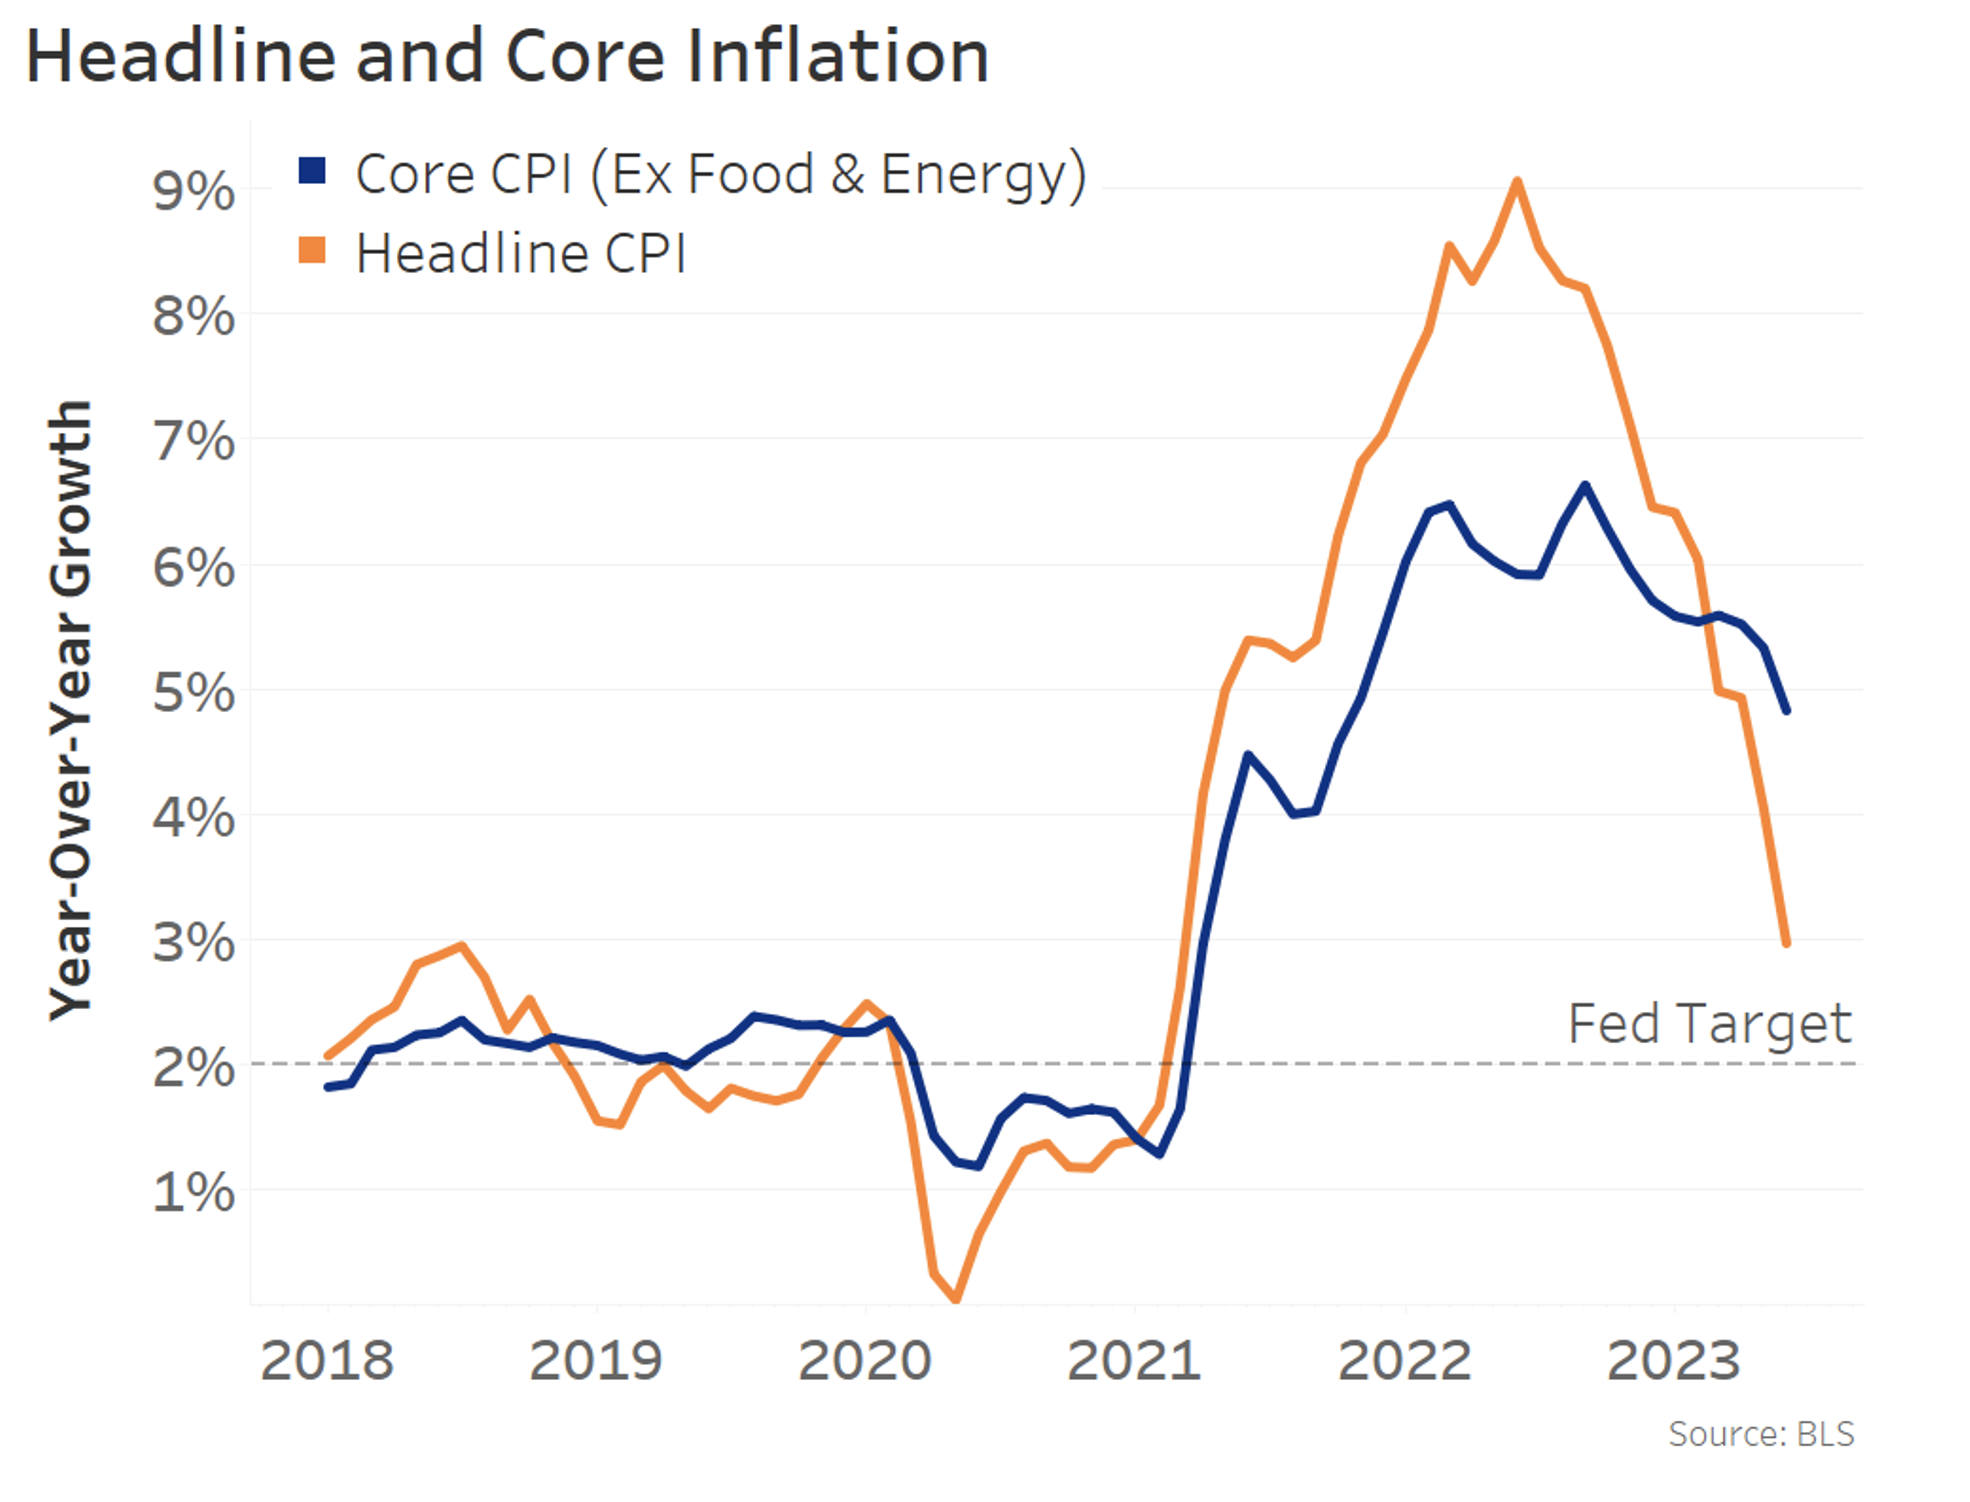
Headline dropped to 3.0% YoY (chart below, orange line) – that’s a lot lower than it was one year ago, when it peaked at 9.1% YoY.
The bigger surprise was that core CPI fell to 4.8% YoY from 5.3% (blue line) – consensus forecasts were for it to only slow to 5.1%.
Headline inflation being pulled down by energy
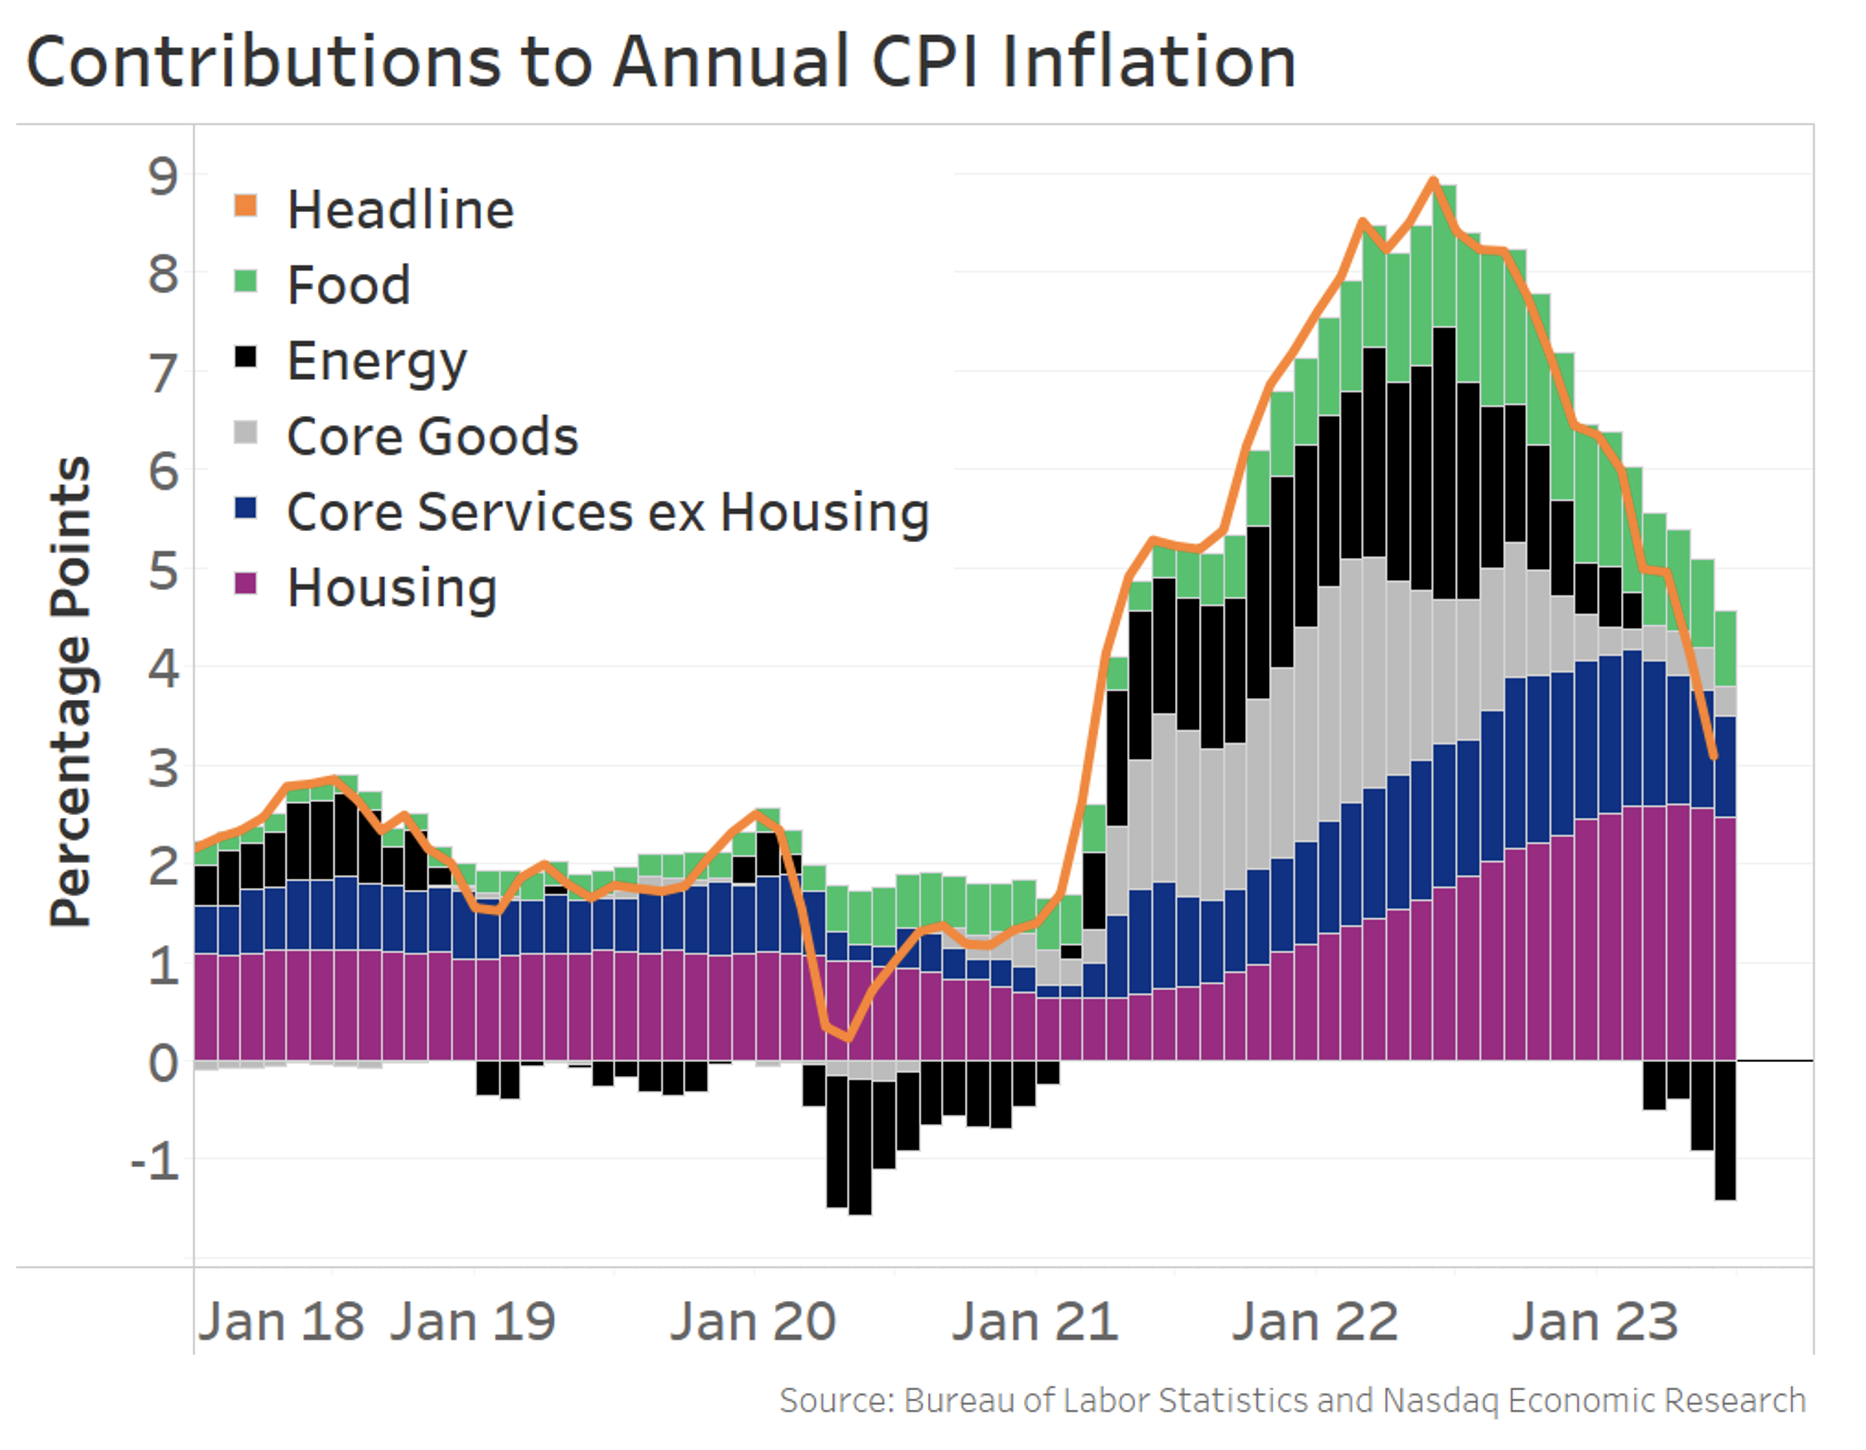
A big reason why we saw headline CPI drop to 3% YoY from 4% in one month is that energy remains a negative contributor (chart below, black bars).
The other volatile CPI component – food (green bars) – is also starting to become a smaller driver, too. June marked its smallest contribution in 20 months, thanks to a combination of slowing wage growth and steady agricultural commodity prices.
Importantly, we’re also starting to see progress on the core components (grey, blue, and purple bars).
Core inflation pulled down by cars, but we're starting to see services and housing slow too
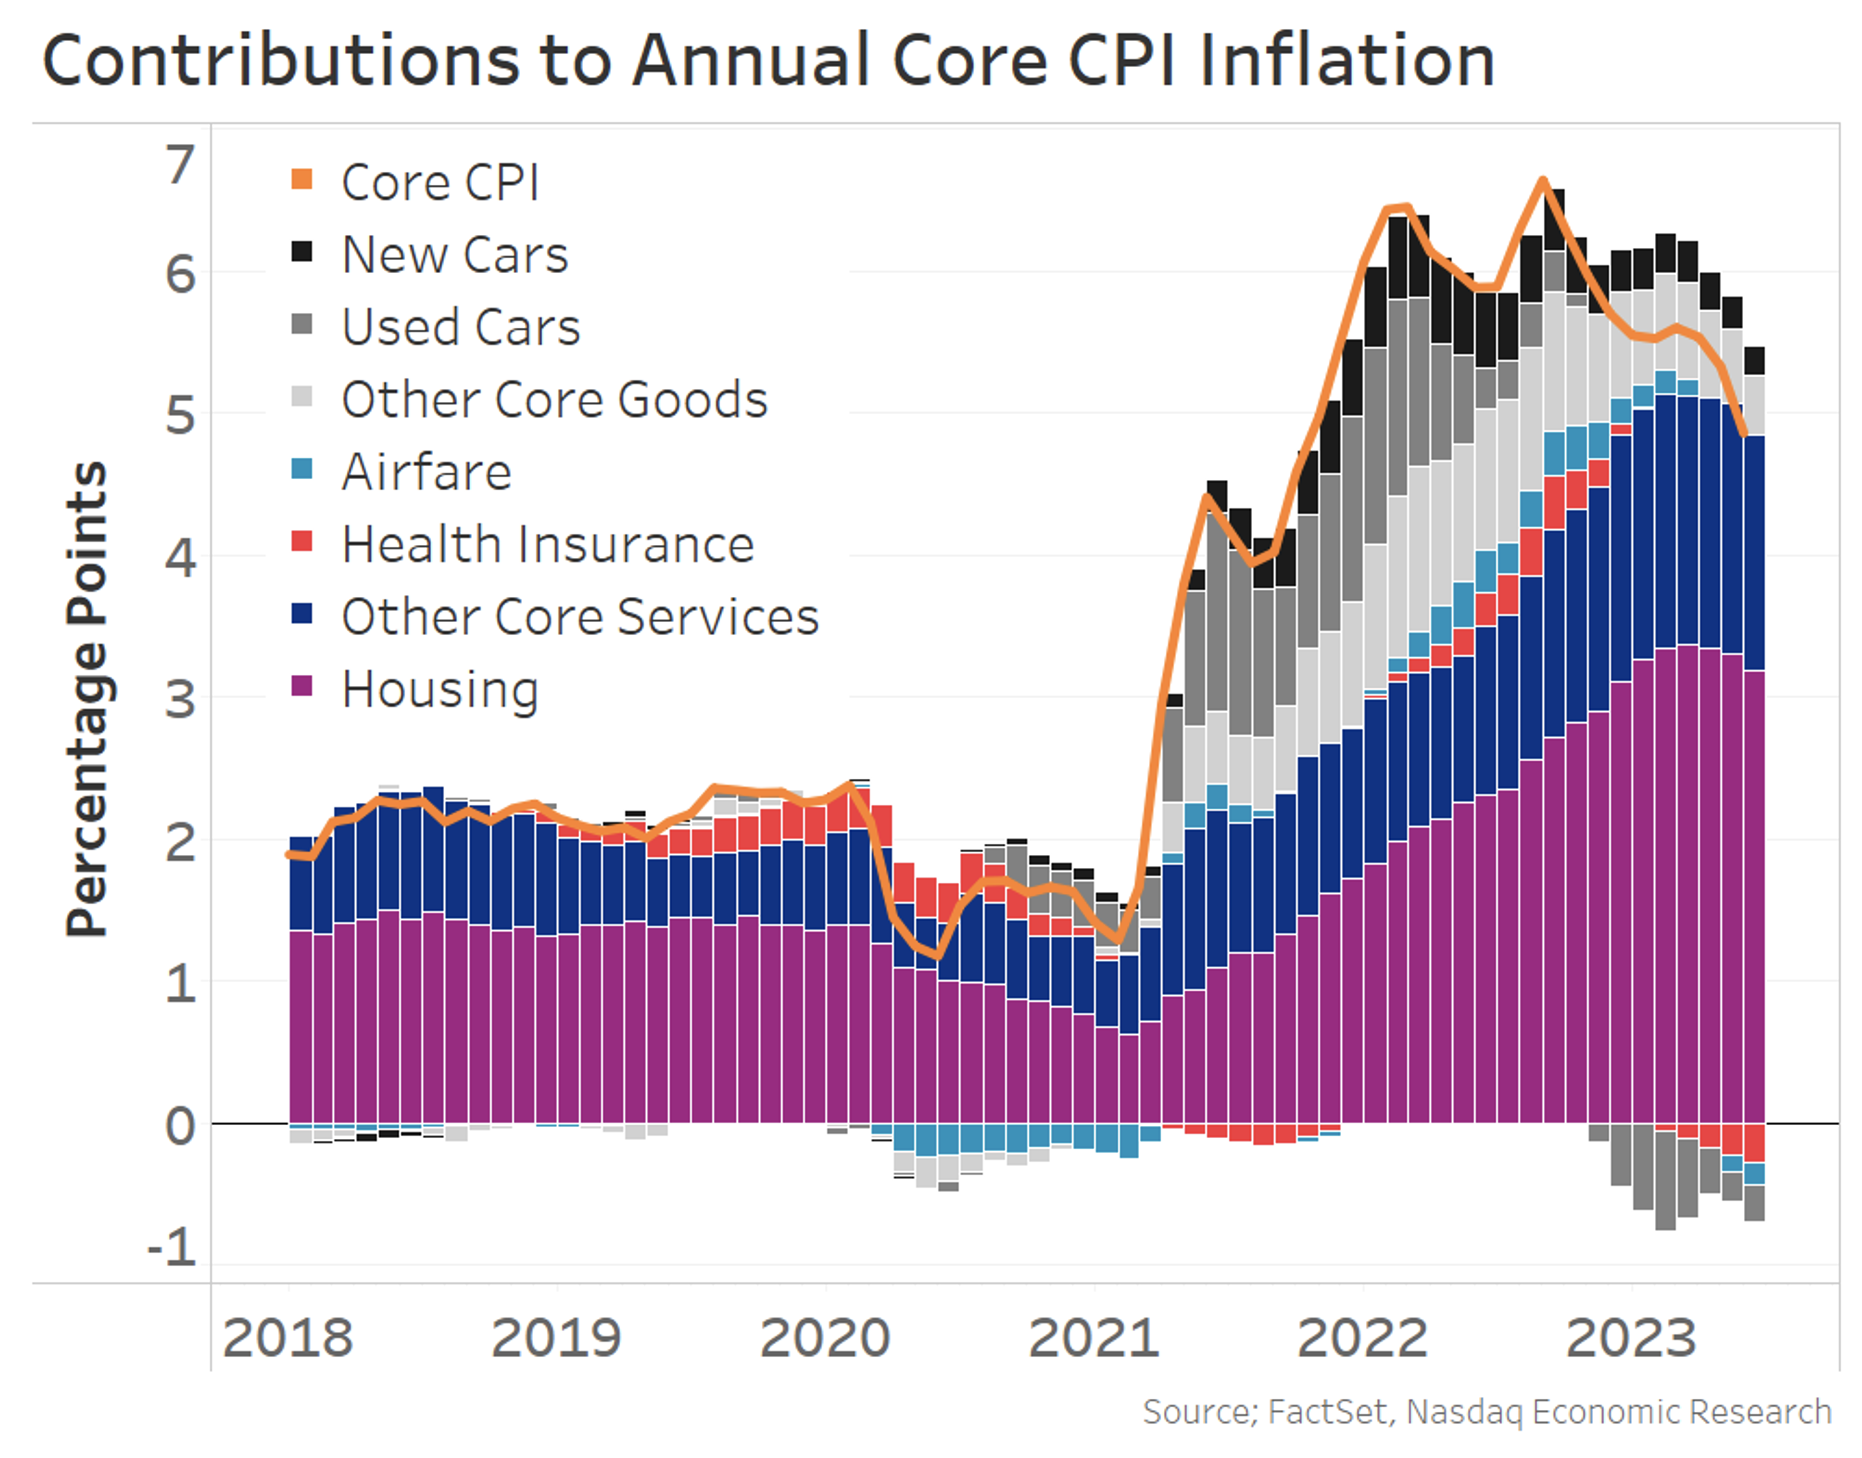
Looking at the breakdown of core CPI drivers (chart below), the most important development for the Fed and markets is that the “sticky” core components – housing and wage-driven core services – are now slowing.
The contribution from housing has slowed for three straight months (purple bars). That should continue because recent research shows housing CPI lags market-based measures by one year, and market-based measures of rent slowed to 0% YoY growth in June while home prices saw their first year-over-year decline in 11 years. So there’s more housing disinflation in the pipeline.
The rest of core services (blue bars), which is largely wage-driven, has now slowed for two straight months and saw its smallest contribution in 7 months, as the still-tight labor market continues to ease at the margin.
We also see some negative contributors already:
- Used car prices (mid-gray bars) are falling thanks to new car inventories improving. Other data show used car auction prices more recently fell 10% YoY
- Airfares (light blue bars) are down because jet fuel prices have fallen
- Health Insurance (red bars) – this is a quirky calculation, but it’s likely to be deflationary for several more months
Despite CPI data, a 25bps rate hike is still likely this month, but odds of second hike are falling
This is the kind of inflation report the Fed has been waiting for.
They want core inflation to slow because it tends to show better what is happening to long-term price inflation, so they care about it more than headline. And in particular, they’ve wanted to see progress on the “sticky” wage-driven components.
But the Fed will want to see these trends continue before they end their rate hike cycle. That’s why markets are still pricing 90+% odds of a 25bps rate hike in two weeks. However, odds the Fed can push through a second rate hike by November have dropped to 25% from 35%.
Increased odds that the Fed’s rate hike cycle ends this month is boosting markets
Lower odds of a second rate hike is good news for markets.
The major equity indices jumped on the CPI data (left chart below), gaining around 0.5-1% today, while 10-year Treasury rates fell over 10 basis points to 3.85% this morning (right chart).
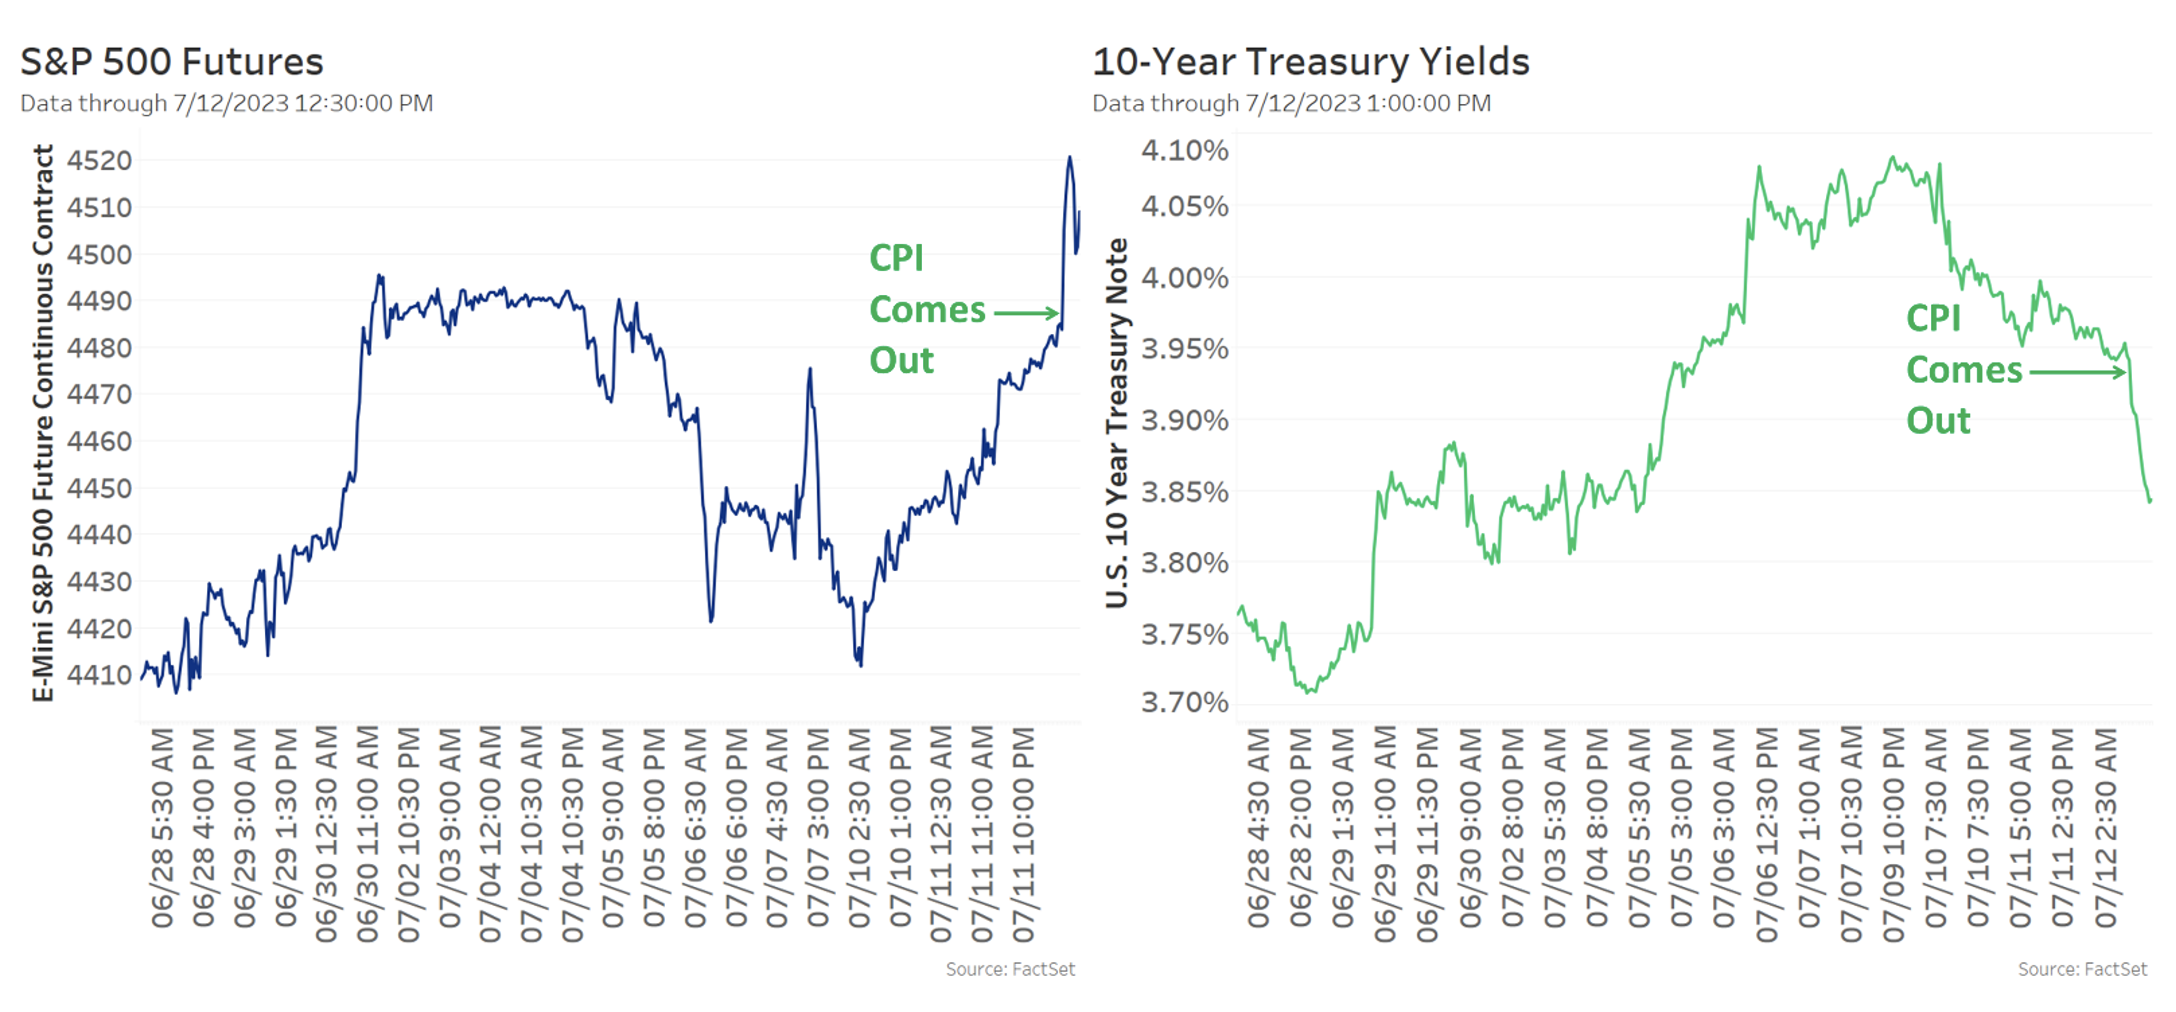
That reversed a chunk of the recent run up in rates. Late last month, 10-year rates were as low as 3.7%, and they rose above 4% in the last week, as markets priced in “higher-for-longer” rates.
But after this CPI report, markets are thinking rates might not need to go as high for as long. That means less drag on the economy, which improves soft landing odds, and that’s good news for earnings and markets.
