
March, First Quarter 2022 Review and Outlook
- U.S. stocks have first quarterly decline since the onset of the Covid pandemic in Q1’20
- Energy, Metals, & Agriculture commodities continue to surge at a historic pace
- Record rise in short rates leads to inversion in 2s10s and 5s30s spreads
- Markets are pricing between eight and nine 25bp FFR hikes by the end of 2022
- The White House will release 1M bpd of crude oil over the next six months, reducing the SPR by 1/3
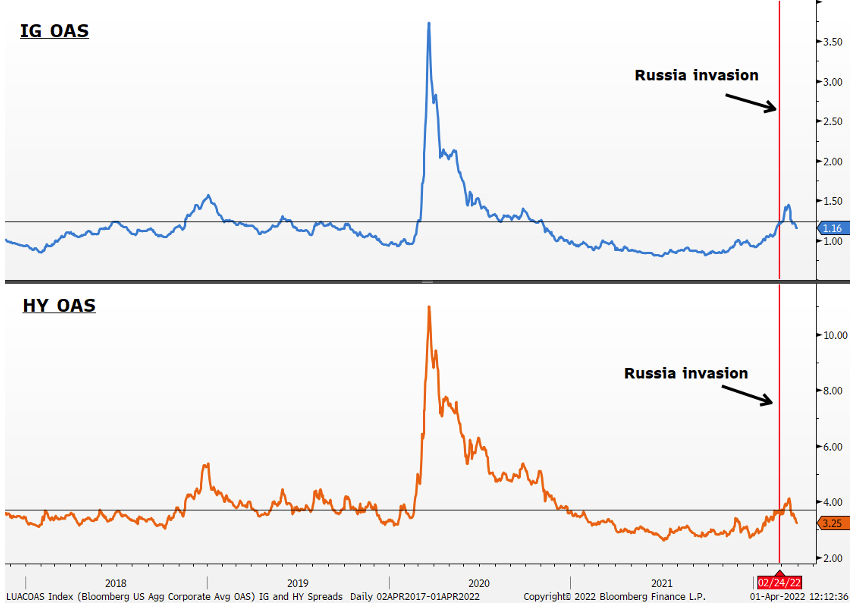
- IG and HY credit spreads have narrowed below pre-Russia/Ukraine levels
U.S. equities closed out their first quarterly loss in two years due initially to soaring inflation and the Fed’s hawkish pivot. Economic measures of inflation had already reached 40-year highs in the previous quarter, with the November CPI registering +6.8%, before climbing higher in consecutive months to the most recent reading of +7.9% in February. It was not until the last day in November when Fed Chair Jerome Powell officially retired “transitory” in describing the central bank’s inflation outlook, yet the monthly asset purchases continued into the last week before liftoff in mid-March.
With global economies still adjusting to Covid’s impact on supply chains and the shift in consumer spending, Russia’s invasion of Ukraine at the end of February was the equivalent of adding fuel to the inflation fire. Commodity and rates accelerated higher from existing uptrends as the West imposed strict sanctions on Russia’s economy and central bank. Ironically, most U.S. equity benchmarks bottomed within a day of the Russian invasion.

Soaring rates had the greatest negative impact on long-duration Growth stocks, which we argued at the start of the year were overdue to underperform Value given their historic run of outperformance and extreme overbought technical measures. In Q1, the large-cap Russell 1000 Value Index outperformed the Russell 1000 Growth Index by more than eight percentage points, while the small-cap Russell 2000 Value Index outperformed the Russell 2000 Growth Index by more than 10 percentage points. For the large-cap indices, this is Value’s strongest outperformance over Growth since the 2000 – 2002 era.
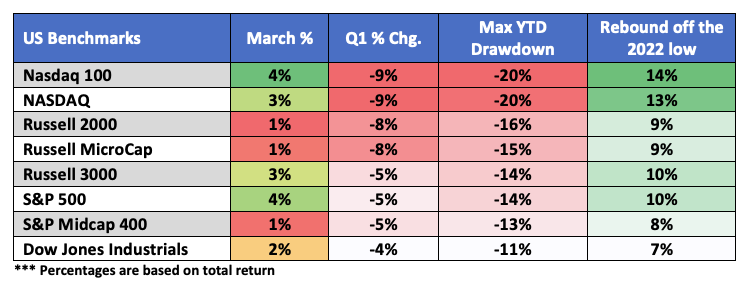
Accordingly, the Nasdaq-100 (-20%) and Nasdaq Composite (-20%) registered the largest declines YTD, while the small-cap Russell 2000 (-23%) and Russell Microcap Indices (-25%) declined the most from their respective 52-week highs. The blue-chip Dow Industrials and S&P 500 indices were the relative outperformers.
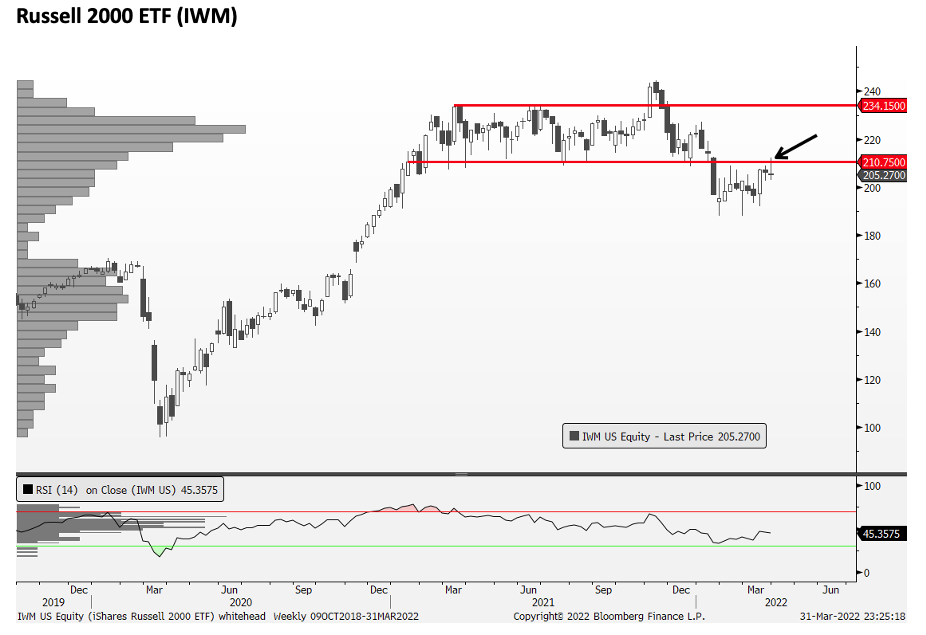
The beaten-down Growth and small caps indices had the strongest rebounds off the 2022 lows; however, the true test lies ahead as to whether this is a temporary relief rally or a new uptrend. In the final week of March, the tracking ETF for the Russell 2000 Index (IWM) reached a key resistance level at ~$210/$211, which previously acted as support for over ten months in 2021. From a technical perspective, prior support often acts as future resistance. Overhead supply only increases above the $210/$211 level, as measured by the volume at price bars on the left y-axis, as a result of the long sideways consolidation throughout most of 2021.
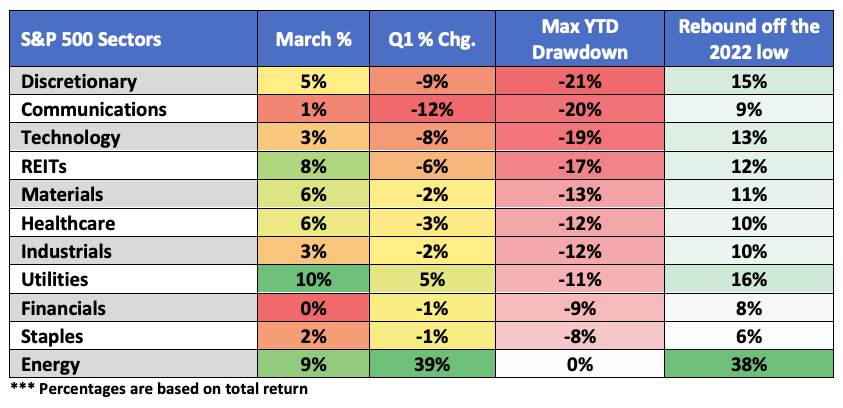
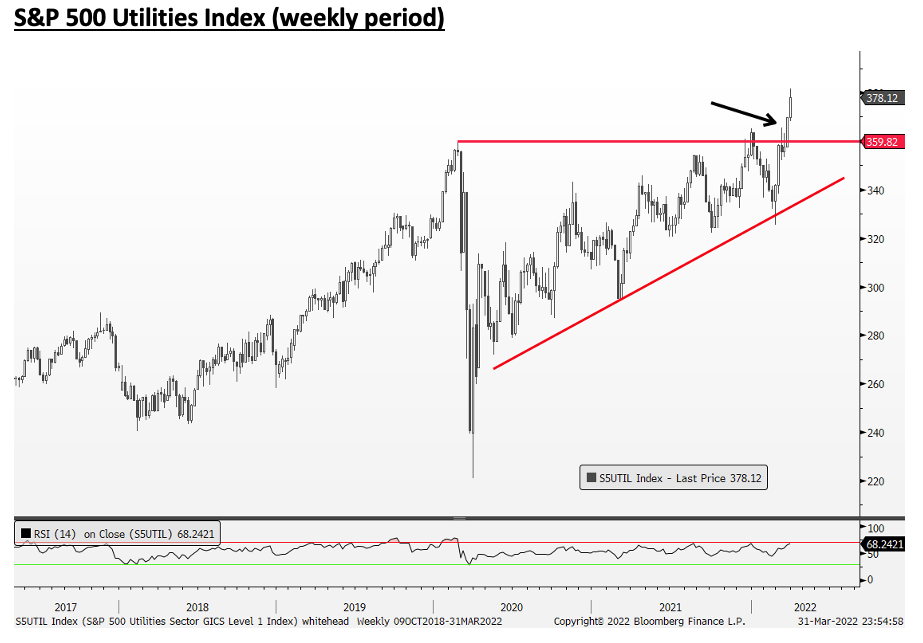
Ten out of 11 sectors finished in the red in Q1. Energy (+39%) had its best quarter since its inception in 1989 on the back of soaring oil and gas prices. The defensive Staples (-1%) held up relatively well, as did the rate-sensitive Financials (-1%). Communications (-12%), Discretionary (-9%), and Technology (-8%) underperformed the most by the end of Q1 and saw the biggest drawdowns. The top performer in March was Utilities (+10%) which in the final two weeks of the quarter made a “bullish breakout” above a major high from February 2020.
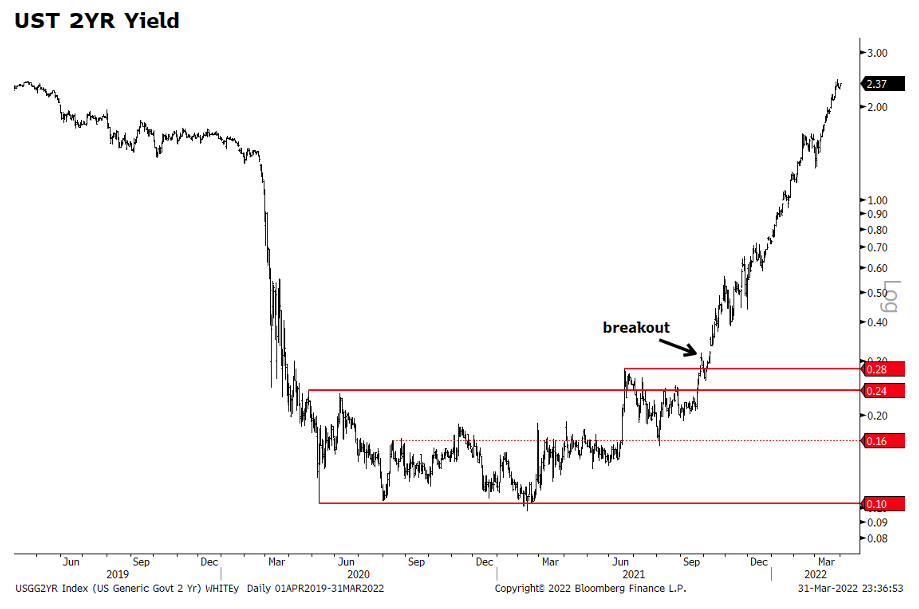
Rates have been surging higher since September 2021, when the 2YR U.S. Treasury Yield, a common market barometer of the Fed’s rate policy, broke higher from an 18-month range, and it hasn’t looked back since. In March, the 2YR yield gained as much as 102bps before ending the month +90bps, its highest gain since May 1984, when it then closed at 12.93%. Since 1980 there have been nine monthly net gains of 90bps or more; however, in all those instances, the yield was significantly higher in the 11% - 15% range.
At the start of Q1, markets were pricing in three 25bps rate hikes for all of 2022. Markets are now expecting between eight and nine rate hikes (25bps), implying a 2.4% Federal Funds Rate (FFR). The first 25bp hike commenced at the March 16 FOMC with unanimous consent by all voting members, aside from St. Louis Fed President Bullard, who wanted to raise rates by 50bps. The accompanying statement and Chair Powell’s press conference were more hawkish than anticipated, as were the committee’s rate projections which included a restrictive FFR forecast above the normalized level in 2023.
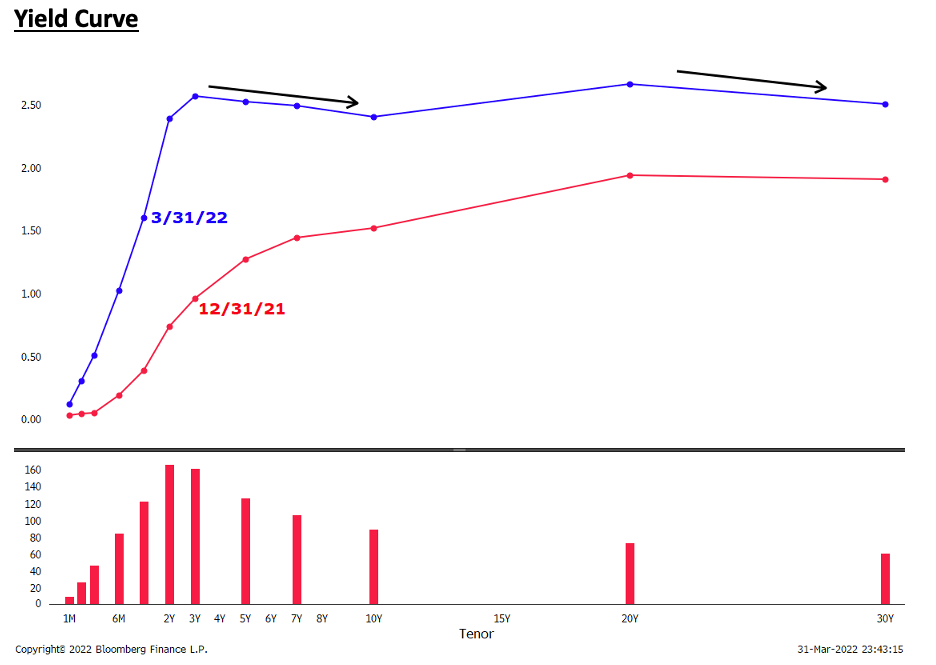
The 2YR and 3YR U.S. Treasury Yields have risen the most in 2022, while inversions are taking place across the longer end of the curve. The 30YR UST yield is below the 20YR, while the 10YR is below the 3YR, 5YR, and 7YR yields.
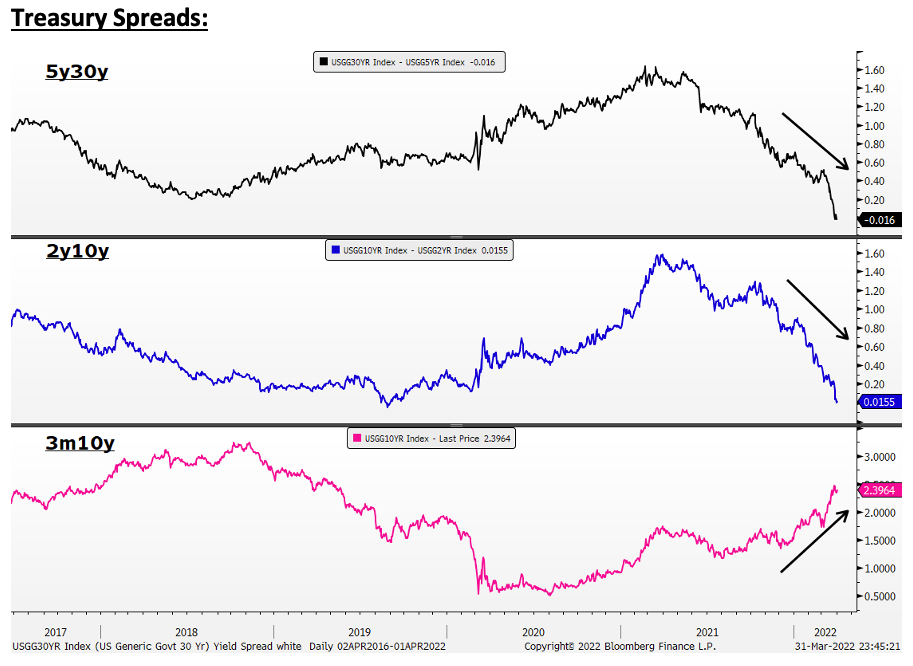
In the final week of March, both the 2yr10yr and 5yr30yr spreads inverted. While inversion is often associated with a recession, it is not a good timing signal as there is often a lag between 12 and 24 months before market tops and the onset of a recession. JPM’s strategy desk notes the prior seven recessions going back to 1967 saw a median and average of eleven months between inversion and a peak in the S&P 500, with an average and median gain of 15% and 14%. The 3m10yr spread typically trends in the same direction as 2yr10yr; however, it currently resides at near three-year wides of 233bps. This anomaly could be a reflection of how far the Fed is behind the curve rather than a leading economic signal.
The sharp rise in rates is impacting homebuilders. Over the last three months, the average rate for a 30-year fixed mortgage rose from 3.27% at the end of Q4’21 to 4.9% ending Q1’22, according to Bankrate. Over this time, the iShares Homebuilder ETF (ITB) declined 29% while closing the quarter at fresh YTD lows.

Following a 27% gain in 2021, representing its best annual performance in 42 years (1979), the Bloomberg Commodity Index (BCOM) advanced 25% in Q1 of 2022. At its high in early March, the BCOM Index gained 42% YTD for its biggest quarterly advance since 1973. Brent crude spiked as much as 79% at its March highs before closing the month +39%. The temporary pullback in crude was due in part to optimism surrounding Russia/Ukraine settlement talks and President Biden announcing the largest ever Strategic Petroleum Reserve release. Other meaningful commodity gains in Q1 include natural gas (+61%), nickel (+55%), iron ore (+39%), wheat (30%), corn (+26%), aluminum (+24%), cotton (+23%), zinc (+20%), soybeans (+20%), and palladium (+18%).
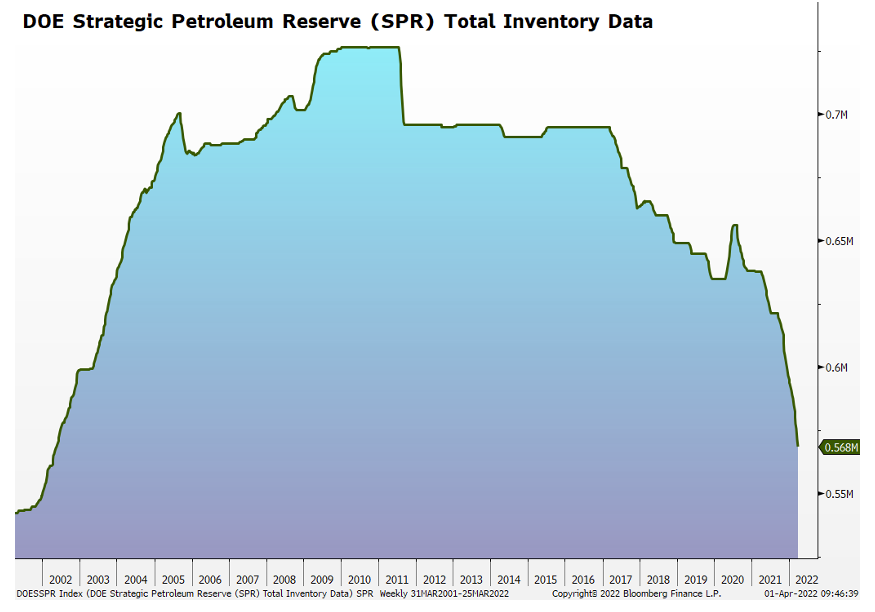
On Thursday, March 31, Biden announced the SPR will release 1 million barrels of oil per day over the next six months to calm spiking energy prices. The 180-million-barrel release of crude amounts to nearly one-third of the nation’s strategic petroleum reserve. Numerous analysts are pointing out that while this historic SPR announcement will help the oil market re-balance this year, it will not fix the structural deficit and rebuild global inventories.
Looking Ahead
Today’s release of the March NFP data confirmed an increasingly tight labor market, leading to upward pressure on wages and the Fed. The unemployment rate fell to 3.6% versus forecasts of 3.7% and the prior month’s 3.8%. Labor Force Participation was 62.4%, in line with expectations and up from February’s 62.3%. Wage growth accelerated to 5.6% from a revised 5.2% in February. While participation is picking up, it is not keeping up with labor demand. Immediately following the release of the payroll data, short rates spiked higher, with the 2YR UST yield reaching new highs and the 2s10s and 5s30s spreads dipping back into inversion territory.
While current economic data shows the economy is strong (i.e., the ISM New Orders index is above 60), the surge in inflation and rates over Q1 is likely to weigh on economic growth, drive wider spreads, and slow corporate earnings. Corporate guidance on wage increases and margins will be a key focus during the upcoming Q1 earnings season. And while there is seemingly little progress made in settlement talks between Russia and Ukraine, credit spreads have pulled back to pre-crisis levels, which typically bodes well for equities.
The information contained herein is provided for informational and educational purposes only, and nothing contained herein should be construed as investment advice, either on behalf of a particular security or an overall investment strategy. All information contained herein is obtained by Nasdaq from sources believed by Nasdaq to be accurate and reliable. However, all information is provided “as is” without warranty of any kind. ADVICE FROM A SECURITIES PROFESSIONAL IS STRONGLY ADVISED.
The views and opinions expressed herein are the views and opinions of the author and do not necessarily reflect those of Nasdaq, Inc.
