
March 2020 had the Largest One-Day Moves Since 1985, But What Does that Mean for Investors?
Within the last two weeks, the Dow Jones Industrial Average (DJIA) has experienced its best day since 1933, which came two days ago on March 24 when the Index gained 11.37%, as well as its two worst days since the Black Monday crash of 1987, which came on March 12 and March 16 when the Dow notched single-day losses of -9.99% and -12.93%, respectively.
This month, DJIA has had 10 days which rank in the largest one-day moves since 1985, as it has had five of its 20 best and five of its 20 worst one-day returns.
To put this into perspective, since 2009 we have had only two days that ranked in the 20 best or 20 worst – December 26, 2018 when DJIA gained 4.98% and August 8, 2011 when the Index lost -5.55%.
No other month since 1985 has had nearly as many of the largest one day moves as March 2020 – October 2008 and October 1987 tie for second which each month owning five. While the sheer number of large moves this month has been unprecedented in recent history, as you can see in the table below, it is not unusual to have these extreme days come in close proximity.

At one point or another, most of us have been told that a small number of the best market days account for the lion's share of any given year’s return. And therefore, the theory goes, investors should be invested at all times to avoid missing these days and the occasional sharp downturn is just a fact of life. Purveyors of this sentiment seemingly view these extreme days as unconnected events that occur in a vacuum. However, as the last few weeks have illustrated perfectly, the best days often occur in close temporal proximity to the worst days and therefore if one were to miss the best days, they might also miss the worst days.
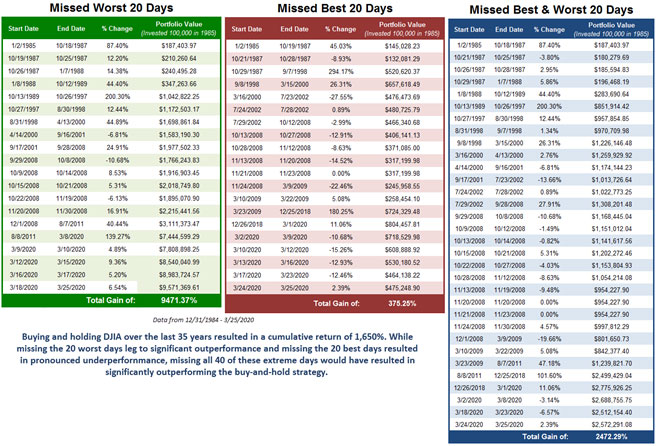
So, is there any truth to the “best days” theory? If the good days and bad days are clustered together, would we better off if we missed these whipsaws all together? To answer these questions, we’ve examined a few hypothetical scenarios. The first is simply buying and holding the Dow from 12/31/84 – 3/25/20, which would have returned 1,650%. The other three scenarios are summarized below:
- Missing the Worst 20 Days - In the green table below, we applied the concept of perfect market timing and side-stepping just the 20 worst-performing days in the DJIA. No doubt about it, the performance would have dramatically improved to the tune of 7,821% in excess of the buy-and-hold option. Said another way, a $100,000 initial investment would have grown to more than $9.5 million since 1985.
- Missing the Best 20 Days - Taking it to the other extreme, what if you had the bad luck to miss the 20 best historical days in the Dow? In the red table below, you'll find that missing out on these integral days of the market causes an underperformance of approximately 1,275% over the last 32 years.
- Missing Both the Best 20 & Worst 20 Days - Realizing that these extreme days typically come in close proximity to one another, we have also shown what would happen if you were to miss both the best 20 days and the worst 20 days. Interestingly, side-stepping all 40 of these days actually provides a better return when compared to simply buying and holding. This hypothetical portfolio would be up 2,472%, outperforming the buy-and-hold scenario by more than 800%
So what does all of this mean to an average investor? What good does it do knowing that the most extreme days are clustered together and that, historically, you’ve been better off if you missed both the best and the worst of them?
Well, the most volatile periods have tended to come in down markets. This begs the question “What is a down market?” Some have quantified it using moving averages, but another way to quantify it is using the NYSE Bullish Percent (BPNYSE). The BPNYSE is an indicator that Nasdaq Dorsey Wright tracks which measures the percent of stocks within the NYSE universe that are trading on Point and Figure buy signals.
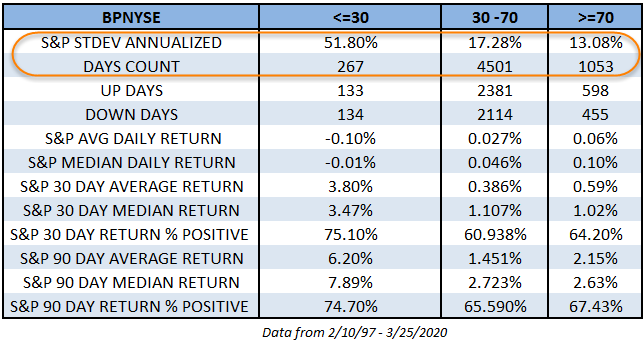
The 30%, and below, level has been looked as the “green zone” on the BPNYSE, and we have historically seen some of the best buying opportunities come from below the 30% level; however, trips to these levels are often uncomfortable. One way to quantify the “uncomfortable” nature of the markets while the BPNYSE is at or below 30% is simply by looking at the standard deviation (or volatility) of the market.
For starters, going back to February 1997 the BPNYSE has only spent about 4.5% of the time at 30% or below while 77% of the days the BPNYSE has been between 30% and 70%. While the bulk of the past 23 plus years has been spent between 30% and 70%, a large portion of the volatility has come while below the 30% level. When the BPNYSE is between 30% and 70% the standard deviation of the S&P 500 has been 17.28%; however, while the BPNYSE has been below 30% the standard deviation has been 51.80%...or more than three times greater.
The idea that the BPNYSE being below 30% is a highly volatile state for the market, but also offers some of the best buying opportunities may seem somewhat counterintuitive. But, as the saying goes “The time to buy is when there’s blood in streets” and blood in the streets means panic, which means volatility. Of course, it’s preferable if you’ve managed not to be one of those bleeding.
As we noted, volatility is significantly lower when the BPNYSE is above 30 and as many of you are undoubtedly already aware, the BP crossed back above the 30 threshold yesterday. Does this mean that the market volatility is over? Quite possibly not. The volatility statistics we’ve cited are averages - outliers do exist. And while the S&P 500 Volatility Index (VIX) has come down from the historically high levels it recently reached, it currently sits just below 61, still a highly elevated level.
The level of the VIX gives us an expected level of annualized volatility based on SPX option activity and at 61 implies daily volatility of about 3.84%. And quite often we have seen the BPNYSE reverse up and down several times before bottoming. As we wrote in November 2018:
Another point worth considering here is the historical action of the BPNYSE around these levels. In short, nearly every time the since ’97 the BPNYSE has fallen to or below 30% the first reversal up wasn’t the move that caused a return above 50%. In other words, it is common for the BPNYSE to see an initial reversal up and subsequent reversal back down before a second reversal up.
Notice around the 1998 bottom, the BPNYSE fell to low of 20% in August, reversed up in September only to reverse right back down in October. The 2002 bottom saw the BPNYSE move to 24% in July, reverse up in August and move to 42% before reversing back down in September 2002. In October 2002, the BPNYSE reversed back up for a second time below 30%. The 2011 and 2015/16 picture on the BPNYSE saw similar amounts (slightly more in 2015) during that bottoming process.
The 2008/09 time period obviously saw much more volatility than other time periods, but even still, during that time you had the BPNYSE make a low in October 2008, retest that low in November 2008 and produce a higher bottom and then again in early 2009 produce yet another higher bottom with the March 2009 low. Interestingly, during that time period, while the BPNYSE was making higher lows, the major market indices were making lower lows.
So, while the last three days have been some of the best single days the market has produced and have certainly been a welcome change, given the current level of the VIX, the historical behavior of the BPNYSE, and that these extreme days, both good and bad, tend to cluster together, it would not be at all surprising if we continue to see large moves in the short-term.
Nasdaq Dorsey Wright offers investors a free trial of the NDW Research Platform, which provides turnkey research and analysis for securities selection, portfolio management and asset allocation. Click here for more information. For questions about the NDW strategies, contact us here.
Dorsey, Wright & Associates, LLC, a Nasdaq Company, is a registered investment advisory firm. Registration does not imply any level of skill or training.
Unless otherwise stated, the performance information included in this article does not include dividends or all potential transaction costs. Investors cannot invest directly in an index. Indexes have no fees. Past performance is not indicative of future results. Potential for profits is accompanied by possibility of loss.
Nothing contained within the article should be construed as an offer to sell or the solicitation of an offer to buy any security. This article does not attempt to examine all the facts and circumstances which may be relevant to any company, industry or security mentioned herein. We are not soliciting any action based on this article. It is for the general information of and does not constitute a personal recommendation or take into account the particular investment objectives, financial situations, or needs of individual clients. Before acting on any analysis, advice or recommendation (express or implied), investors should consider whether the security or strategy in question is suitable for their particular circumstances and, if necessary, seek professional advice.
Dorsey Wright’s relative strength strategy is not a guarantee. There may be times when all assets are unfavorable and depreciate in value. Relative Strength is a measure of price momentum based on historical price activity. Relative Strength is not predictive and there is no assurance that forecasts based on relative strength can be relied upon to be successful or outperform any index, asset, or strategy.
Other Topics
Coronavirus
Contact Us
Dorsey Wright SMA

Nasdaq Dorsey Wright
Nasdaq
Nasdaq Dorsey Wright is a registered investment advisory firm with more than 30 years of expertise is technical analysis, specifically focusing on the steadfast relationship between supply and demand in the markets. Our research and tools help our clients see through the day-to-day clutter of market movements while providing a clear understanding of where market strength lies at all times.
Read Nasdaq Dorsey Wright's Bio