Large Queues are a Small-Cap Problem
We recently looked at queue times for liquid stocks, and noticed the NBBO of most large cap stocks was less than 30 seconds.
Today, we look at the entire stock universe and see that queues move far slower for less liquid stocks, although that’s not because of trading incentives and spread economics.
Long queue time is a bigger problem for small-cap stocks
Generally, small cap stocks trade less than large cap stocks, if for no other reason than they have less capital to trade. So although the chart below shows actual liquidity (in dollars), that’s a good proxy for market cap too.
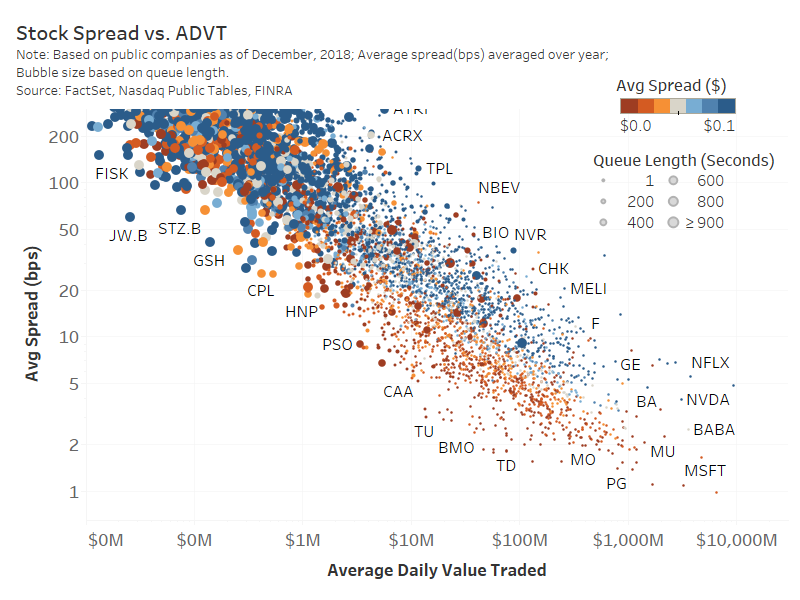
The chart below looks across all National Market System stocks, with circle size representing the average time to trade the quantity on the NBBO, but this time a large circle is over 15 minutes (900 seconds).
This shows queues (circles) on liquid stocks on the right side of the chart are actually very small compared to less liquid stocks.
Chart 1: Comparing spreads and NBBO queue time across all stocks

Source: Nasdaq Economic Research
There are some other interesting phenomena you can see in this chart:
- This chart shows liquidity in dollars on the horizontal axis and spread in basis points on the vertical axis. So the downward diagonal of the data shows that spreads contract consistently as liquidity increases. That seems to indicate that all liquidity is good for trading costs.
- The bottom right tickers, which are the most liquid stocks in the U.S., consistently have brown color below blue. Brown circles represent stocks trading naturally with one- or two-cent spreads, while blue circles are stocks trading with a spread 10+ cents wide. We could theorize those blue stocks have ticks too narrow for their liquidity, or, said another way, stock prices that are “too high.” Although the big brown circles in that corner are also high, but they are the tick-constrained stocks with longer queues we’ve discussed above.
- For smaller stocks trading $1 million or less each day, those patterns seems to almost disappear. That’s one reason it’s harder to incentivize market makers to quote those stocks, even though those quotes are important to retail traders. Because they are difficult to track in this way.
Why is this important?
Although today’s chart is complicated, the data show how differently stocks trade across various metrics, including, we learned here, how decimal ticks seem to hurt high priced stocks. That’s one reason why we suggest intelligent ticks and rebates in our TotalMarkets whitepaper.
