
June, Second Quarter 2021 Review and Outlook
Executive Summary:
- Equity benchmarks soared to record highs in 1H 2021, underpinned by a healthy rotation across a range of industries
- The Fed reaffirmed its commitment to stimulus efforts despite hawkish undertones at the June FOMC
- Interest rates and yield spreads experienced meaningful reactions to the June FOMC
- The U.S. Dollar Index (DXY) realized its biggest monthly gain (June) since Q4’16
- Following two consecutive quarters of underperformance, Growth outperformed Value in Q2

U.S. equity benchmarks closed the first half of 2021 at or near record highs as the economy continues its reopening and more and more people are returning to work. Historic fiscal and monetary stimulus has provided a consistent tailwind since the Spring of 2020, and there is little evidence those efforts will be removed anytime soon.
After stumbling out of the gate in January, the flagship S&P 500 has strung together five consecutive monthly gains and finished the first half of 2021 with a total return of 15.2%. Smaller caps have outperformed, led by the Russell Microcap (+29% YTD) and Russell 2000 (+17.6% YTD) indices. The Nasdaq 100 (NDX) underperformed with a relatively modest gain of 13.3% YTD; however, this is more than respectable given the large-cap growth index outperformed the S&P 500 by more than 30 percentage points in 2020. More recently, the NDX was the top performer in both June and Q2 as a rotation has recently shifted back towards Growth over Value.
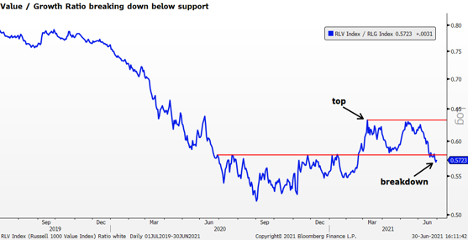
The Russell 1000 Value Index (+16.9% YTD) has outperformed the Russell 1000 Growth Index (13% YTD) by 3.9 percentage points in 1H 2021. However, Value’s outperformance peaked in March and in recent weeks has reverted towards Growth due in large part to a more hawkish Fed at the June FOMC. Over the last week, the Value / Growth ratio has broken down below a key technical level in place since June of 2020, suggesting a continuing trend favoring Growth outperformance.
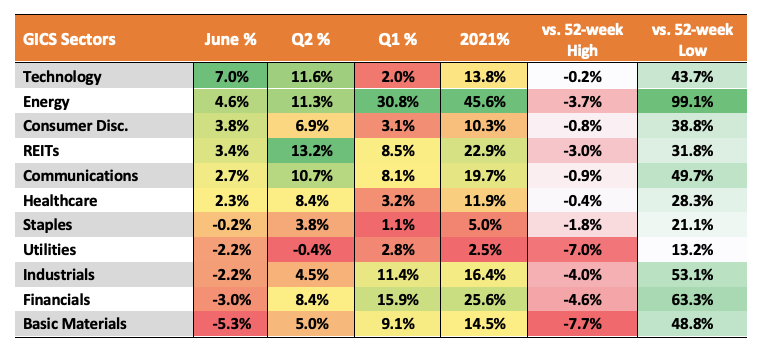
Energy (+45.6% YTD), Financials (+25.6% YTD) and REITs (+22.6% YTD) were the top-performing sectors in 1H 2021. This follows 2020, in which they were the three worst-performing sectors. All three benefited from the “reopening” trade, which took flight in Q4 on better than expected Covid-vaccine efficacy results announced throughout November. The defensive Staples (5%) and Utilities (+2.5%) have been the laggards in 1H’20. Technology benefitted from the rotation back to Growth with a leading 7% total return in June and 2nd best 11.6% total return in Q2.
The S&P 500 Energy Index finished June with eight consecutive monthly gains for a total return of 94.6%. This ties its longest streak of monthly gains since its inception in 1989 (~32 years). WTI crude has finished higher over each of the last five quarters and ended Q2 with a YTD gain of 51.4%.
Rate-sensitive Financials came into June with a streak of four consecutive monthly gains and higher six of the prior seven months but declined 3% in June following a hawkish FOMC, which meaningfully impacted the fixed income markets. The group stabilized late in the month, heading into the release of the Federal Reserve’s stress test results on June 24. While the announcement was widely expected, the Fed announced banks were well capitalized and lifted the last of the pandemic-related restrictions on returning capital to investors.
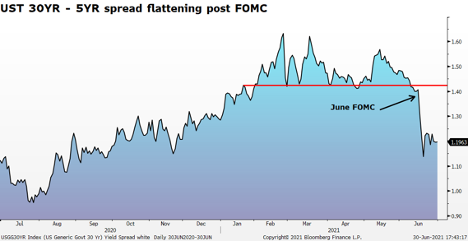
The June FOMC tapped the brakes on the reflation trade as the dot plot unveiled two unexpected rate hike projections in 2023, along with increased inflation and economic projections for 2021. Chairman Powell attempted to dampen the committee’s hawkish forecasts by noting the recovery needs substantial future progress while stressing any future changes to the asset purchase program will be “orderly, methodical and transparent.” The Fed also raised both the overnight RRP rate and IOER by 5bps in what was widely viewed as an effort to establish a higher floor under the effective Fed funds rate. Fixed income responded accordingly, with the short end rising sharply and the long end falling. In less than three sessions following the June FOMC, the 30YR - 5YR UST spread declined a dramatic 27bps, wiping out all its gains since November. The 30YR UST and 10YR UST yields each declined all three months in Q2 following four consecutive monthly gains.
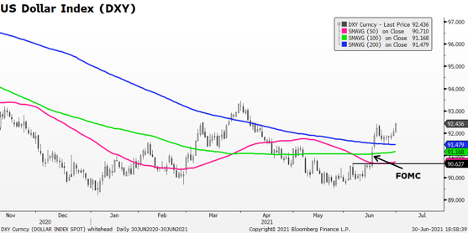
The hawkish FOMC also impacted the greenback, with the U.S. Dollar Index (DXY) seeing its biggest two- and three-day gains since the peak of the risk-off, pandemic fears in March of 2020. In just two sessions, the DXY broke above its 50-day, 100-day, and 20-day moving averages and successfully held those levels into the quarter’s end. The DXY rallied 2.9% in June for its largest monthly gain since November 2016.
Looking Ahead:
Q2 earnings season kicks off next week, and expectations are higher than average. According to Factset, 21% of the S&P 500 have issued EPS guidance which is right in line with the five-year average of 20%. Within this sample, a record 66% have issued positive EPS guidance versus the five-year average of 37%. On the revenue front, 17% of S&P 500 companies issued revenue guidance versus the five-year average of 15%. Within this sample, 80% issued positive revenue guidance versus the five-year average of 52%.
There are risks to the recovery and mixed signals being given off by the markets. However, there is plenty of debate about how those concerns will unfold. Recent economic measures of inflation are well above the Fed’s 2% inflation “average,” giving credence to reducing fiscal and monetary stimulus sooner. However, market measures of inflation have begun trending lower. Long rates (30’s and 10’s) peaked back in March and early April, while break-evens peaked in mid-May. This may support the Fed’s “transitory” outlook on inflation while suggesting the rising inflation data could soon peak.
The hawkish June FOMC seemingly caught markets off-guard, and this week Fed President Rob Kaplan stated in a Bloomberg interview that the Fed should begin tapering asset purchases before the end of 2021. However, Kaplan is not a voter this year, and only two members of the voting committee are “plotting” a rate hike before 2024. In addition, Chairman Jerome Powell has set a high bar before pulling back on stimulus.
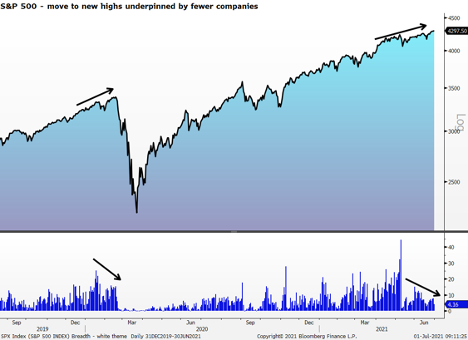
U.S. equity benchmarks are hovering around record highs; however, fewer and fewer stocks are driving those gains. As the S&P 500 has broken out to record highs from its May consolidation, the percentage of companies within the index making new highs stands at just 4%.
Seasonality is another consideration over the near term. Since 1950 the S&P 500 has had an average gain of 0.7% in Q3. In comparison, Q1 and Q2 averaged 2.2% and 2.1%, respectively, while Q4 has an average gain of 4%. On a monthly basis, however, July ranks as the 4th best performing month since 1950. August and September rank in the bottom quartile, making Q3 the worst-performing quarter on average.
The information contained herein is provided for informational and educational purposes only, and nothing contained herein should be construed as investment advice, either on behalf of a particular security or an overall investment strategy. All information contained herein is obtained by Nasdaq from sources believed by Nasdaq to be accurate and reliable. However, all information is provided “as is” without warranty of any kind. ADVICE FROM A SECURITIES PROFESSIONAL IS STRONGLY ADVISED.
The views and opinions expressed herein are the views and opinions of the author and do not necessarily reflect those of Nasdaq, Inc.

