Is This the Year the Rising Rates Trade Finally Pays Off? First Quarter 2021 Income Investing Recap
The bond market picked up in 2021 where it left off in the fourth quarter of 2020, with the yield on the benchmark 10-year U.S. Treasury rising from 0.93% on December 31, 2020 to 1.75% on March 31, 2021. The dramatic move spelled carnage for fixed-income markets, with the Bloomberg Barclays Aggregate U.S. Bond Index losing 3.4% during the quarter (bond prices move in inverse to bond yields).
The surge in interest rates followed Democratic victories in two January 5, 2021 Georgia special elections that resulted in a 50-50 deadlock tie in the upper house, with the Democrats holding the vice-presidential tie-breaking vote. The victory lap for Democrats culminated in a record-breaking $1.9 trillion stimulus package that left bond investors wondering whether an overheating economy might force the U.S. Federal Reserve to raise interest rates sooner than had previously been anticipated.
Meanwhile, stock market investors cheered on the stimulus package, with the S&P 500 Index delivering a 6.2% total return during the quarter. Expectations of increasing corporate earnings driven by faster economic growth more than offset the impact of rising rates on discounted future earnings for most companies. High-growth companies with earnings concentrated further out in the future were notable laggards, with the tech-heavy Nasdaq-100 Index returning 1.5%.
After dominating the financial news for the better part of a year, Tesla lost its crown as the most interesting single-stock story to a declining bricks-and-mortar retailer that operates in an industry perfectly situated for digital delivery. After closing 2020 at $18.84 per share, the stock of GameStop Corp. rocketed to an intraday high of $483.00 per share on January 28, 2021, driven by an upstart amateur investor with a name not fit for print who rallied a Reddit community to squeeze short-selling hedge funds. The stock receded from its lofty heights, but still returned 907.5% for the quarter and left at least one prominent hedge fund in disarray.
No investing recap for the first quarter would be complete without referencing peak SPAC. So-called blank-check companies, which raise capital with the intent to later merge with a private company, went to the capital markets and loaded up the truck during the first quarter. Issuers launched 298 SPACs that raised $88 billion over the three-month period, compared to 248 SPAC IPOs with proceeds of $83 billion for all of 2020. Some 430 SPACs now sit on $140 billion in cash seeking merger partners, with another 250 proposed SPACs on file with the Securities and Exchange Commission (SEC). Meanwhile, the pool of private companies ready to merge into a SPAC looks increasingly thin even as the SEC steps up regulatory scrutiny on the disclosure practices used to promote such mergers. History suggests that large pools of liquidity chasing limited investment opportunities rarely ends well.
First Quarter Performance by Category
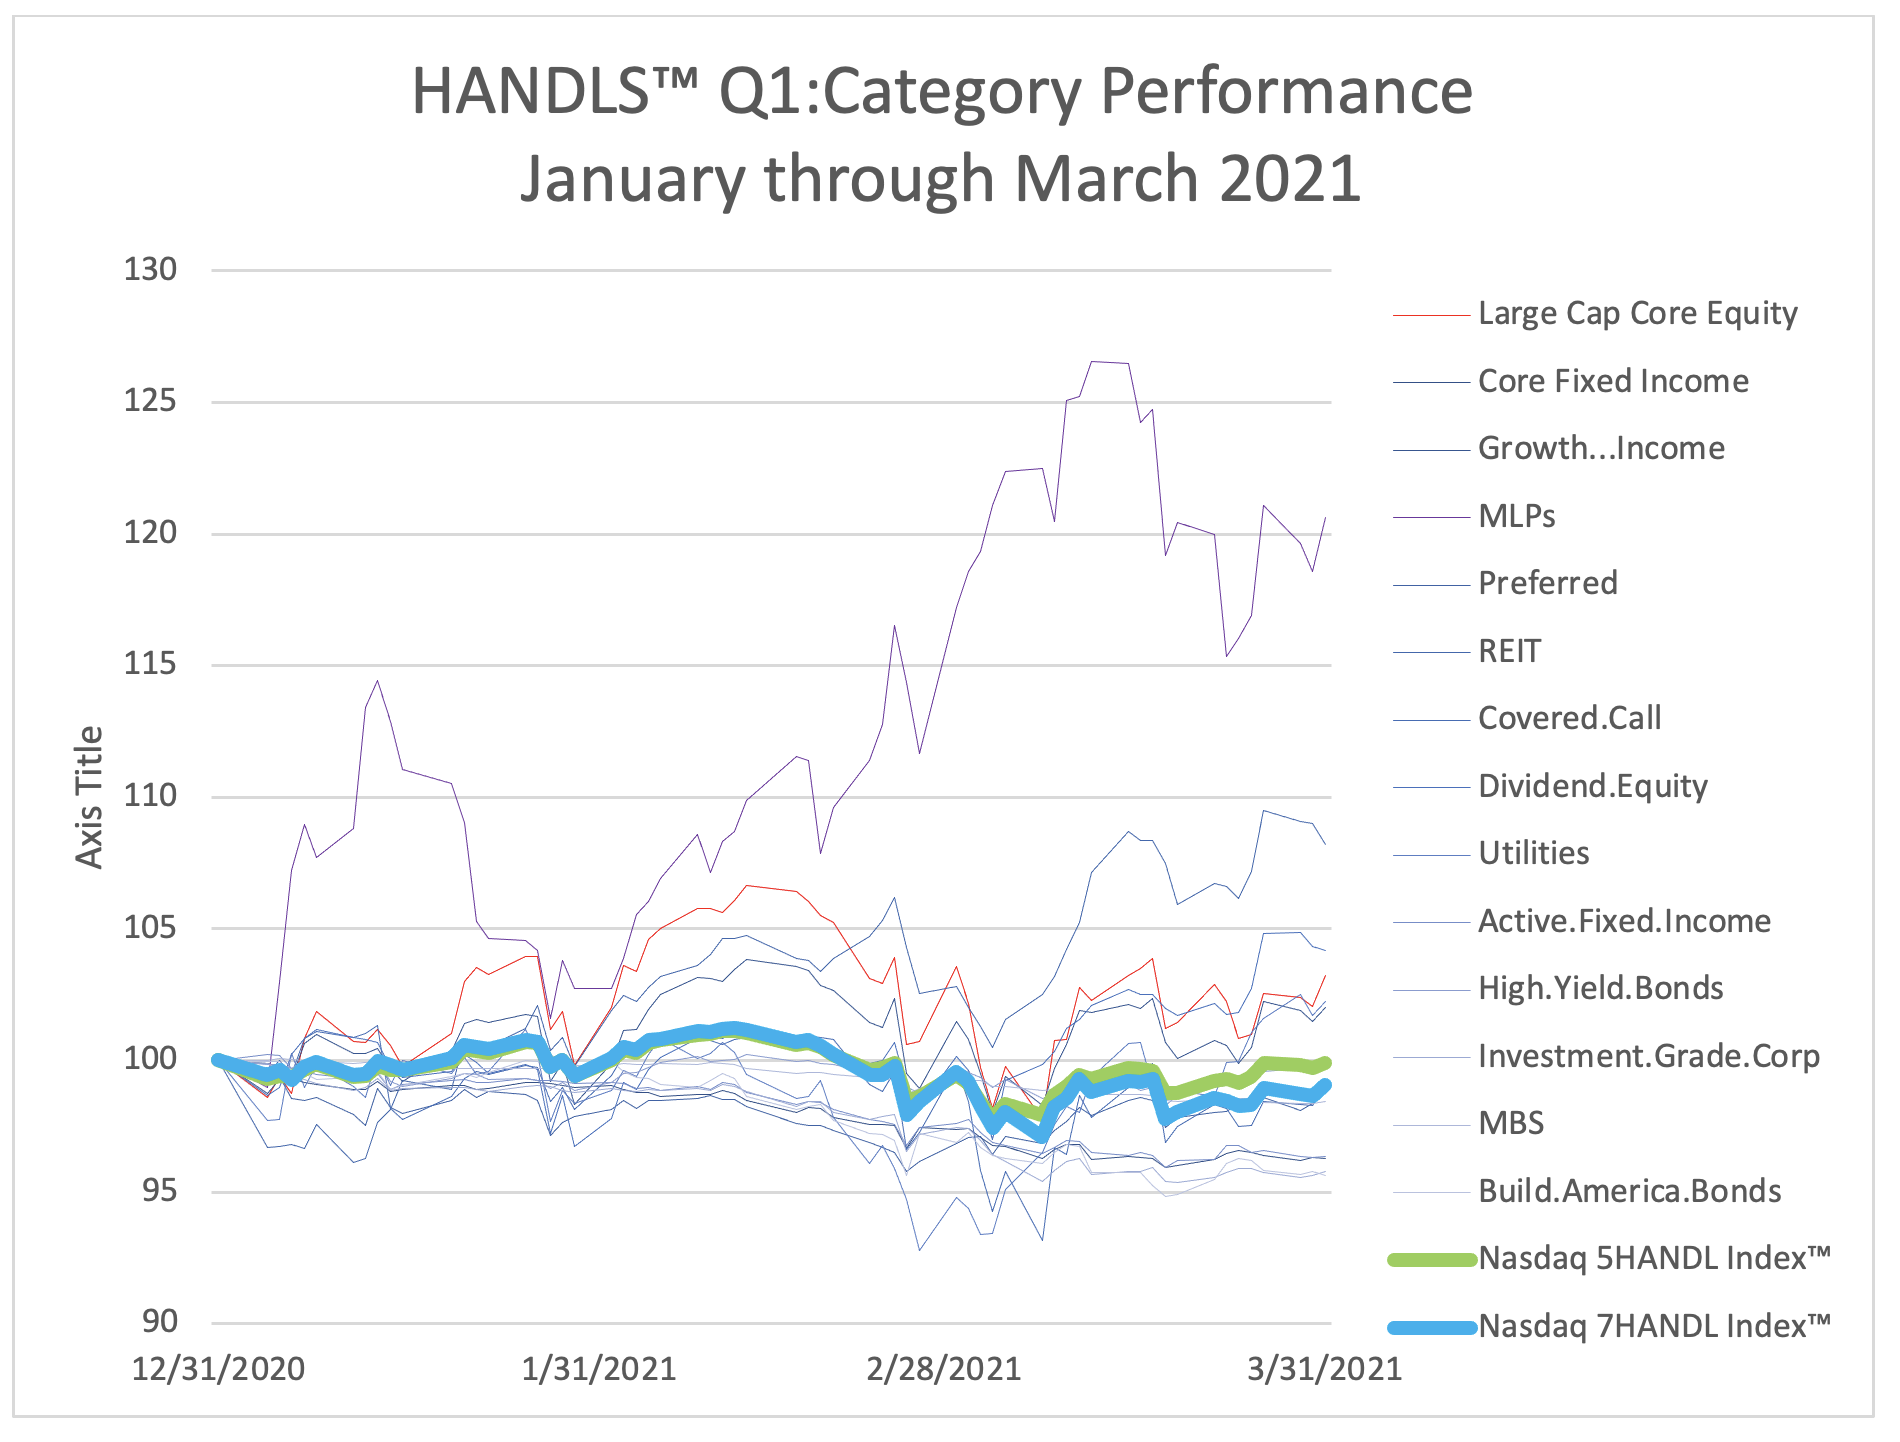
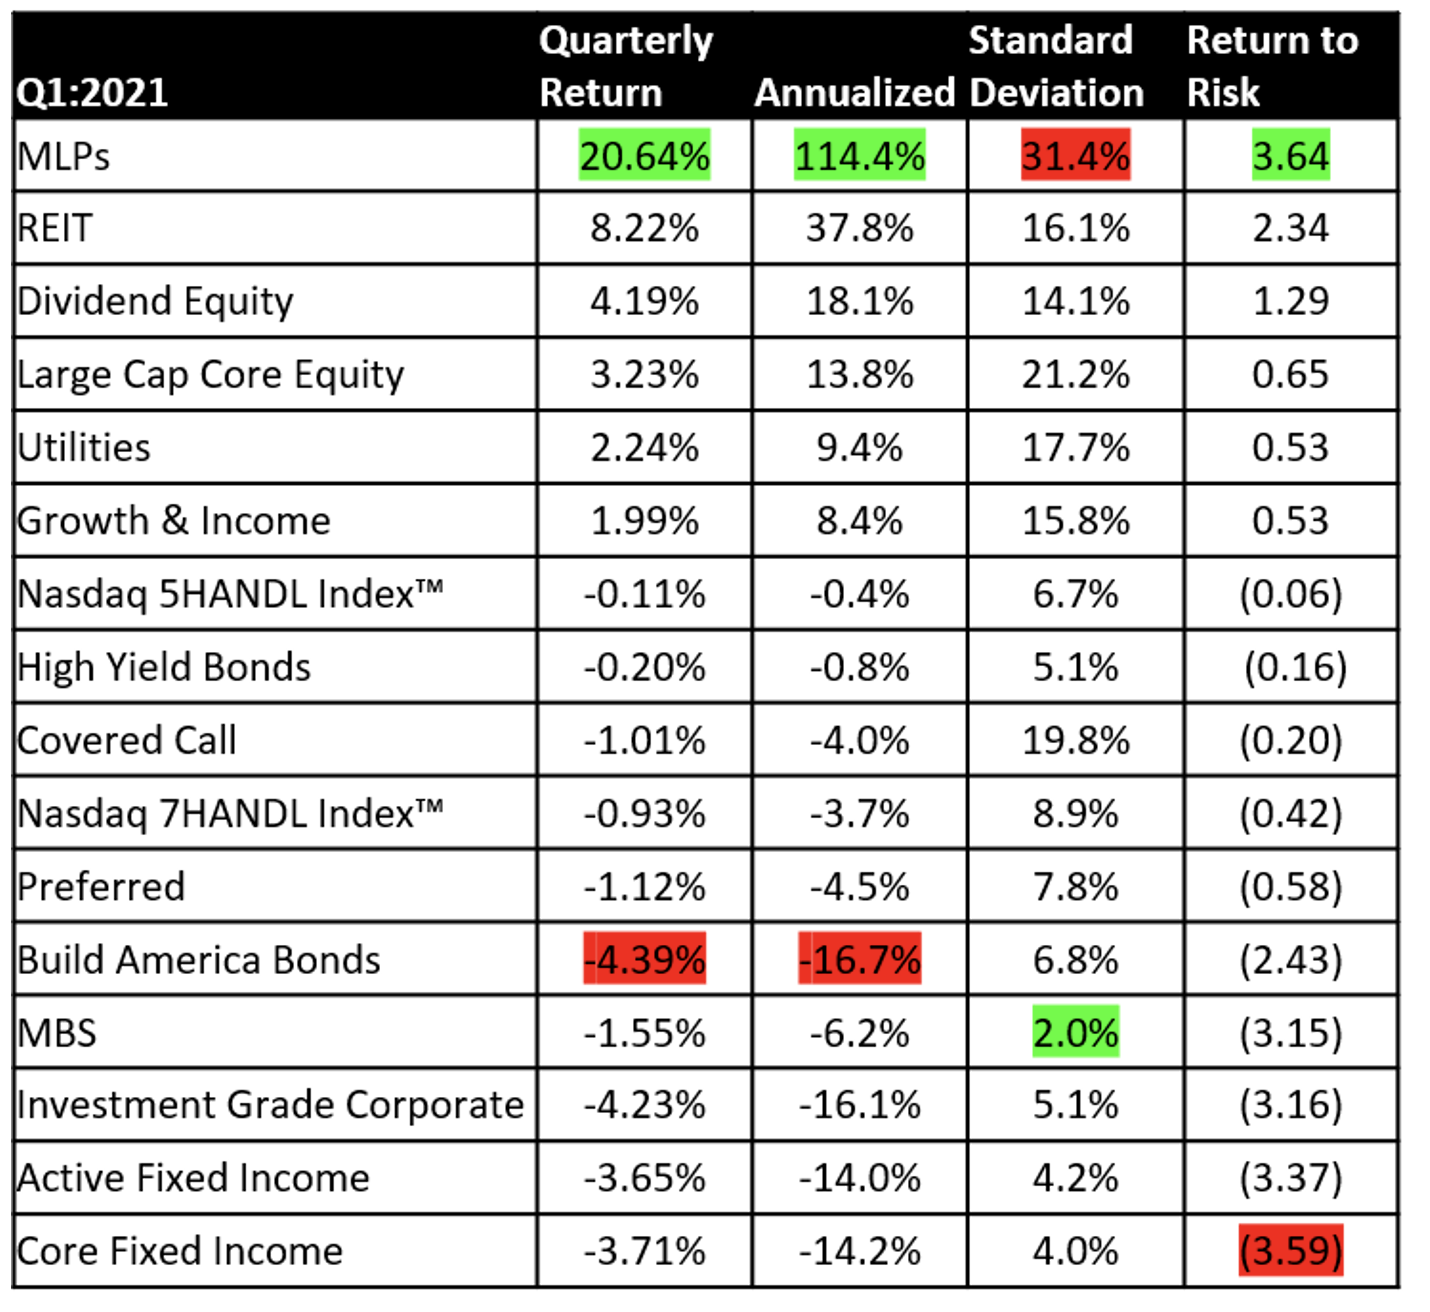
The first quarter was a mixed bag for income investors. The table below provides return data for major income-oriented asset categories for the period from January 1, 2021 through March 31, 2021.[1] Also included are returns for the Nasdaq 7HANDL Index and Nasdaq 5HANDL Index, two multi-asset indexes of ETFs. While equity-based categories generally performed favorably, every fixed-income category lost money as rising interest rates pushed down bond prices.


For the third time in the last five quarters, MLPs outperformed every other income-oriented asset category on both an absolute and risk-adjusted basis[2]. Despite these pockets of sunshine, MLPs remain the worst performing income-oriented asset category on both an absolute and risk-adjusted basis since the beginning of 2020. While MLPs offer income investors high distributions and outsized potential returns, such rewards come with high levels of volatility.
REITs were another solid performer in the first quarter, as vaccination rollouts and declining COVID case counts drove optimism in the commercial office space and leisure / hospitality sectors. While Americans seem eager to get back on the road after a year spent homebound, questions remain as to whether demand for commercial office space will return to pre-COVID levels or instead remain muted in an economy increasingly built around telecommuting.
Fixed-income categories occupied the bottom five spots in the category performance rankings during the first quarter, with core fixed income delivering the worst returns on a risk-adjusted basis. Build America Bonds and investment grade corporates generated the worst absolute returns, with the corporate bond market turning in its worst quarterly performance since the 2008 financial crisis.
The Nasdaq 7HANDL Index and Nasdaq 5HANDL Index, which incorporate all the income-oriented asset categories, returned -0.9% and -0.1%, respectively, for the quarter.
Long-Term Performance by Category
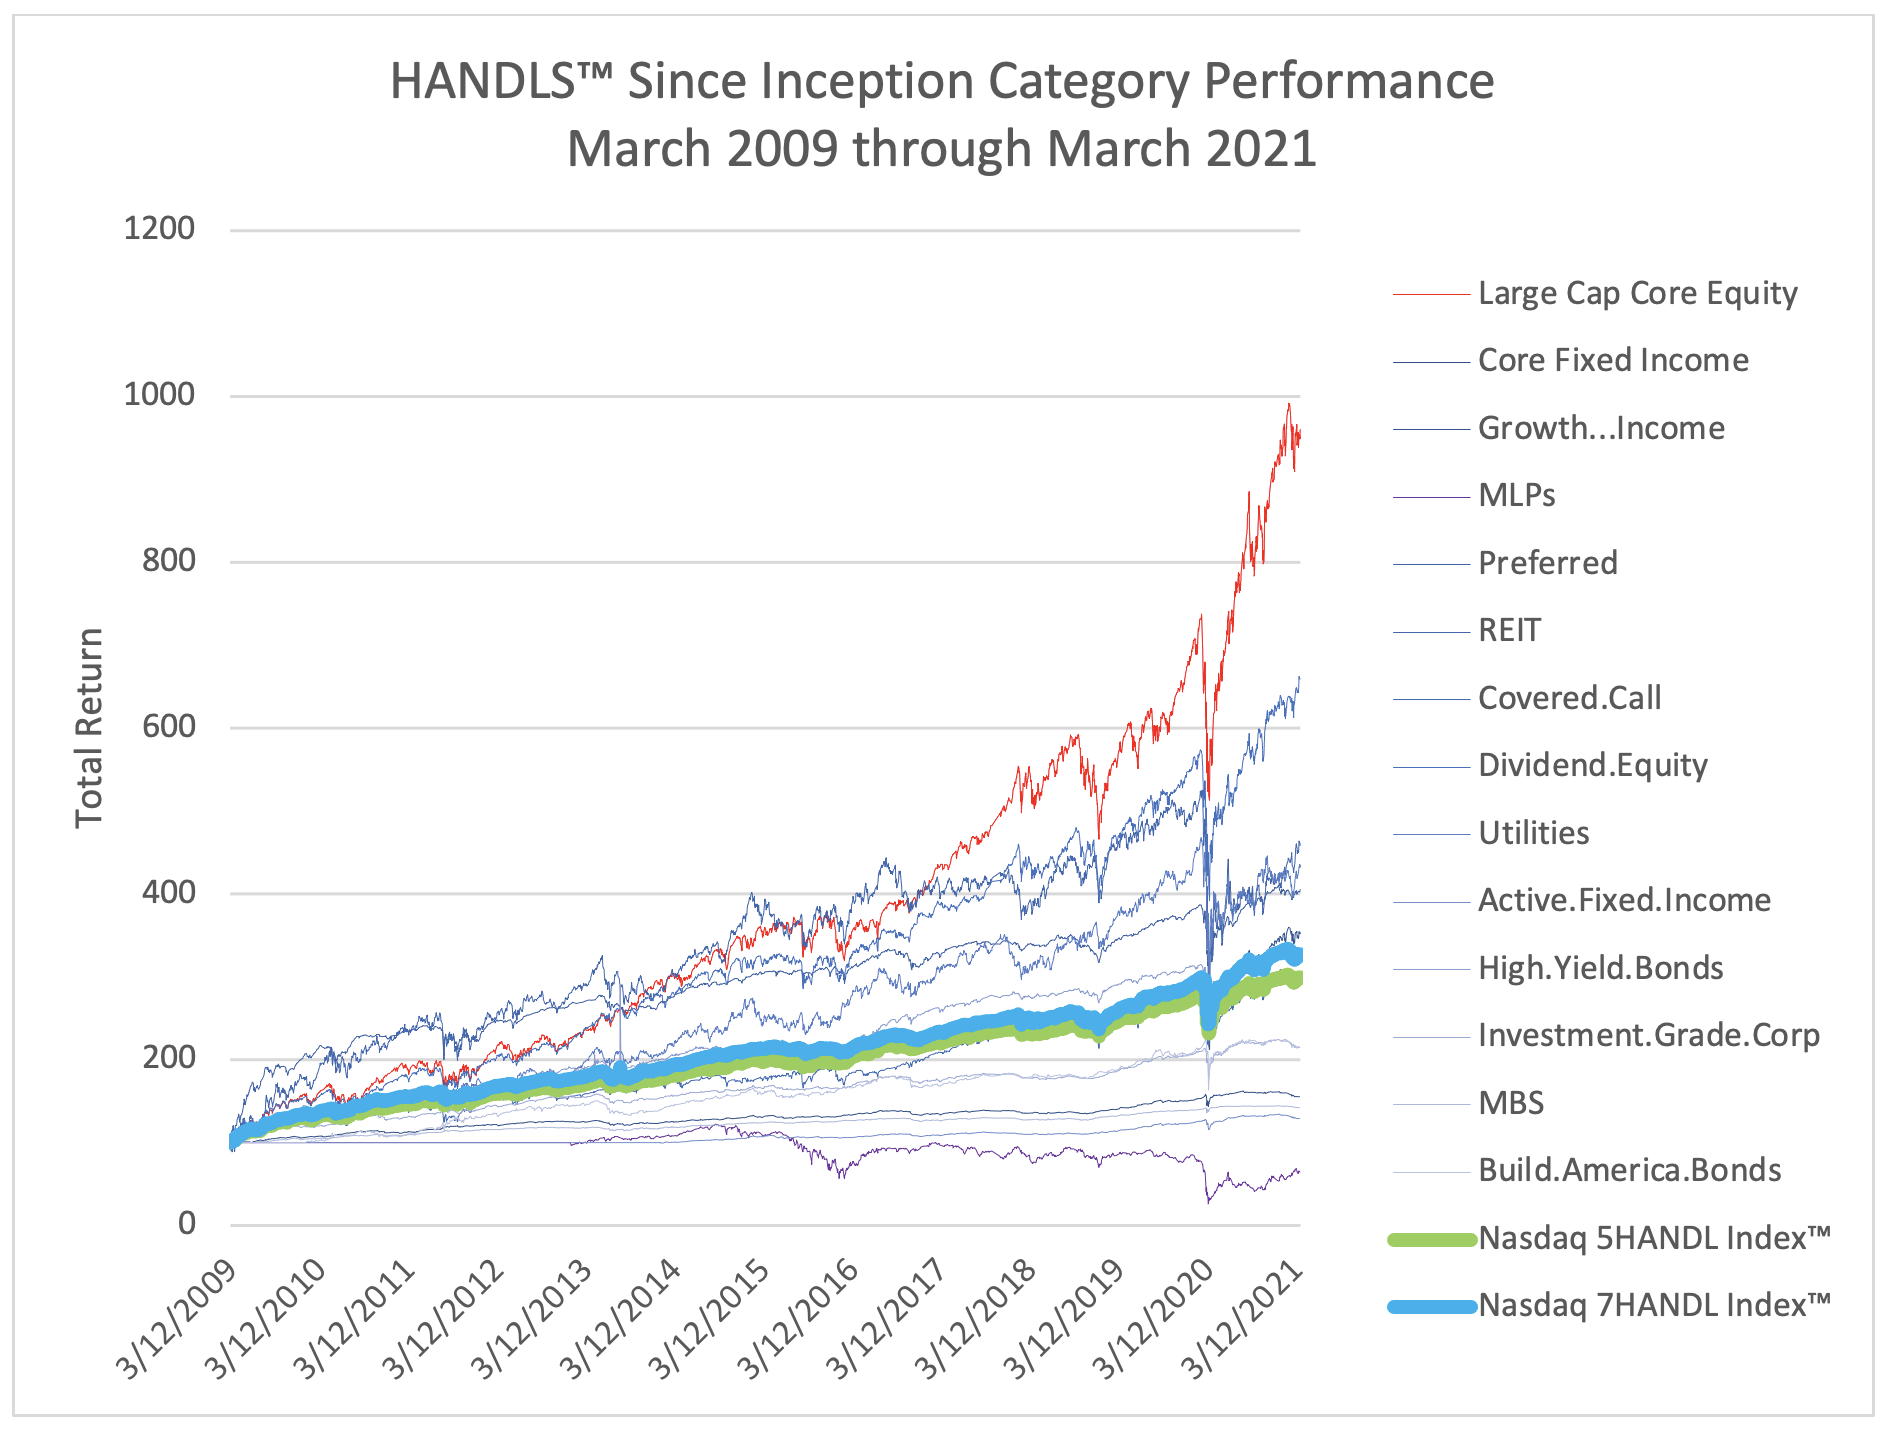
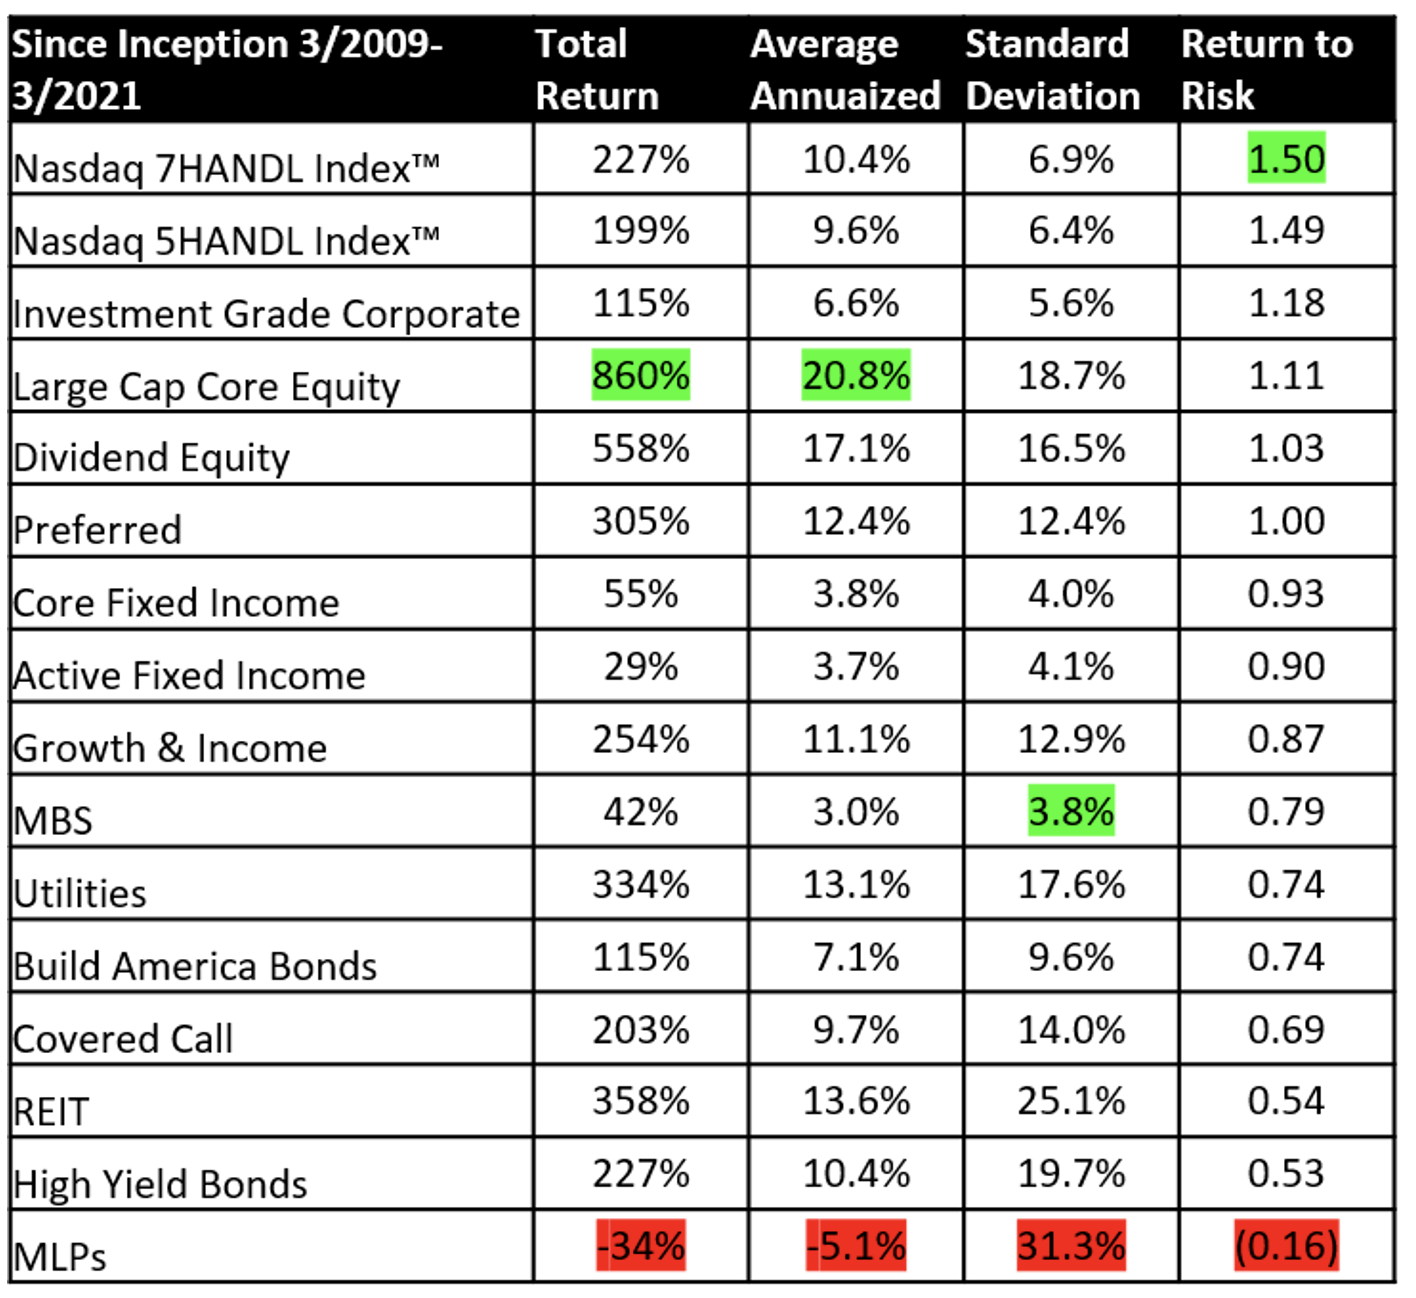
The long-run picture continued to illustrate the power of diversification. The table below provides return data for the same asset categories for the period from January 1, 2009 through March 31, 2021. The highest total returns came from riskier asset categories, with core equity leading the pack. The highest risk-adjusted returns, however, were generated by the indexes of ETFs offering diversified exposure to all the asset categories.


Outlook for Second Quarter
For income investors, the question arises as to whether rising interest rates over the past five months presage a long-term trend. For the better part of a decade, bets on rising rates have been one of the most crowded, and least successful, trades on Wall Street. Much depends upon the impact of the Biden Administration’s fiscal policies on inflation. Despite a blowout fiscal stimulus package, however, inflation expectations remain muted, at least as implied by the market for Treasury Inflation-Protected Securities.
Opinions on the direction of interest rates vary among some of the most influential commentators in the bond market. Goldman Sachs released a forecast in early March predicting that the 10-Year U.S. Treasury would hit 1.9% by the end of 2021. At the other end of the spectrum, Scott Minerd, Chief Investment Officer of Guggenheim, opined around the same time that excess capacity and high unemployment could lead to negative interest rates in 2022 despite the flood of liquidity pumping through the system.
A second question for income investors involves President Biden’s proposed tax plan, which seeks to raise income tax rates on corporations and high-income individuals. All else remaining equal, higher income tax rates reduce after-tax returns on investment and can be expected to put downward pressure on equity valuations. The impact on interest rates would depend in part upon the size of spending package that accompanies tax increases, and whether the net effect of the combining spending and tax packages is stimulative or contractionary.
For now, with the Senate deadlocked at 50-50 and the filibuster in place, the prospects for passage of the Biden Administration tax plan appear dim. Even with the option of reconciliation on the table (which would avoid having to overcome a filibuster), crafting a tax package that would generate unanimous support among the Democratic caucus seems unlikely. For Democrats from more conservative states, higher taxes pose career risk that politicians generally prefer not to take. Meanwhile, while Democrats from more liberal states favor higher taxes, they wish to include restoration of the state and local tax deduction as part of any package—a potential deal breaker for any politician from a low-tax state.
The uncertainty surrounding the direction of interest rates and tax policy poses significant risk for income investors. Maintaining well-diversified portfolios that seek to maximize risk-adjusted returns while protecting against large drawdowns remains the best strategy for managing such risk.
[1] Returns for each asset category are based on the returns of the constituent(s) in the Nasdaq 7HANDL Index representing that category.
[2] Risk-adjusted returns are calculated by dividing annualized return by annualized standard deviation.
The views and opinions expressed herein are the views and opinions of the author and do not necessarily reflect those of Nasdaq, Inc.
