This update begins with a question. Is there market weakness on the horizon? As Yogi Berra said, “it’s tough to make predictions, especially about the future.” While we cannot predict with certainty what the markets will have in store, we can look at the market characteristics that are in place today and quantify the market’s current level of risk.
This update will focus on the strengths and weaknesses of the market’s largest stocks, the pivotal chart pattern being seen in small cap stocks, and most importantly, portfolio management in this environment.
Large Cap Stocks
If you were to only look at the market’s largest stocks, those same seven technology-related stocks we mention in many updates, you would think that markets are doing very well this year. Stocks such as Apple, Amazon, Tesla, Meta and Nvidia have seen substantial rallies in 2023 and have had a large impact on the movements of many major market indexes.
Although on a percentage basis, these large cap technology-related stocks have risen sharply, the rises have not offset the significant declines that these stocks saw last year. Some large technology-related stocks like META, AMZN and TSLA are up 140%, 63% and 154% respectively in 2023. These same stocks are still down more than -11%, -17% and -31% from their respective price levels to begin 2022. The point is that it takes a much larger percentage rise to breakeven following a large decline.
Given their significant rises in 2023, the strength of just a few large cap technology-related stocks has distorted the overall health of the markets. As noted in last week’s update: “The median S&P 500 stock is only up 2.9% year-to-date, and 45% of S&P 500 stocks are actually down.”
Large, sharp rallies that follow major declines are often unsustainable and will eventually lead to a large shift in supply and demand. These increases have been parabolic. Parabolic curves have a tendency to change directions quickly, and violently.
Small Cap Stocks
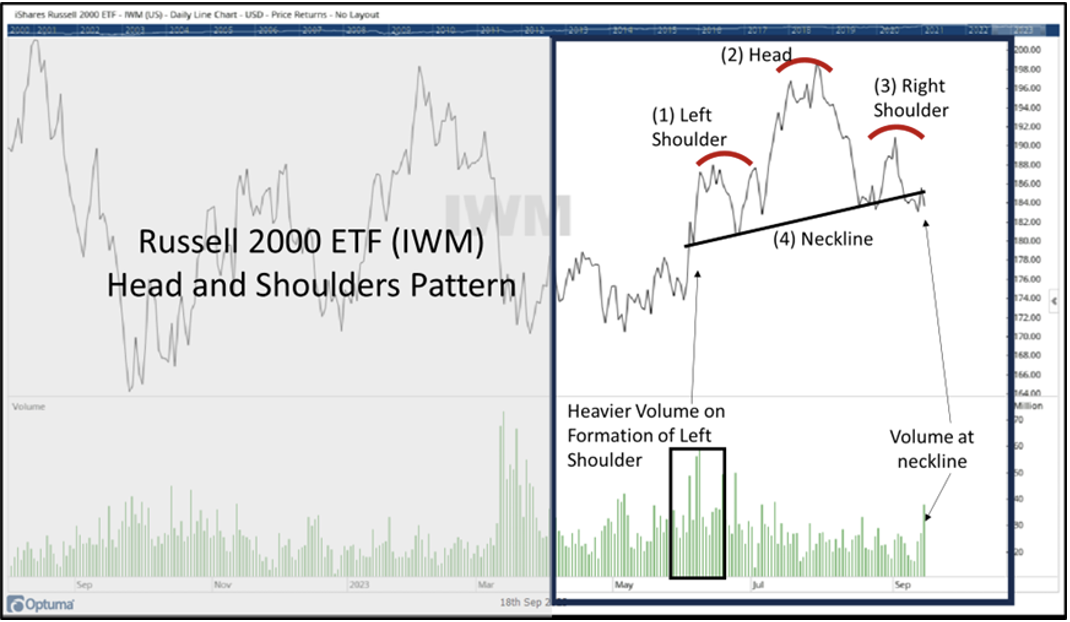
Looking a small cap stocks, market weakness is very apparent. The Russell 2000 index is down more than -20% from its November 2021 high. As pointed out by our good friend and fellow Chartered Market Technician, Gregory Krupinski, the small cap stock index has formed a “head and shoulders” pattern over the last few months.
A head and shoulders pattern is viewed by technicians as one of the more reliable trend reversal patterns. It signals the potential change from an uptrend to a downtrend. The pattern has 4 basic characteristics: a left shoulder (1), a head (2), and a right shoulder (3), as well as a “neckline” (4) for support. The left shoulder is formed on higher trading volume than both the head and right shoulder. Once prices break below the “neckline” that is a signal of trend reversal, although prices will often retest the neckline for resistance. This is all labeled in the chart of the Russell 2000 below.

Bottom Line: Portfolio Management
From a portfolio management perspective, being overly exposed to technology stocks, like the S&P 500 is, poses significant risks. Technology has been one of the few areas in the market to see strength this year. In 2023, the largest technology-related stocks have far outpaced 90% of the other S&P 500 stocks and have become parabolic. That means that they have a high level of risk at this point. These same stocks underperformed 90% of S&P 500 stocks last year. While it is okay to have some exposure, you would not want to put most of your eggs into a basket that could potentially break soon. For example, the market’s largest stock, Apple, has begun to show some recent weakness and volatility following its substantial rally.
Looking past large cap securities, small cap stocks are forming some bearish characteristics. In addition to the head and shoulders pattern mentioned in this update, the Russell 2000 is currently sitting on its 200-day moving average, which can act as support. Given its recent weakness, it would not come as a surprise to see this moving average be broken.
This is a market that could go in either direction. While there is yet to be a trend reversal, many areas are showing relative weakness, and only a select few have shown strength. Energy, which was highlighted in last week’s update, continues to be the number one rated sector as energy prices continue to climb. On the other hand, a few “inverse” positions have begun to climb our rankings list, with Inverse Russell 2000 being an example.
Our adaptive portfolio management process currently has exposure to energy stocks, as well as some technology stocks, but is not overweight in technology. It also has inverse positions in the market segments that are showing negative characteristics, such as Real Estate and small cap stocks. The purpose of these positions is to provide stable portfolio fluctuations. As markets continue, and sector leadership rotates, the portfolio will continue to adjust its holdings and allocations.
The views and opinions expressed herein are the views and opinions of the author and do not necessarily reflect those of Nasdaq, Inc.
