
With its stock down 5.5% over the past three months, it is easy to disregard MSA Safety (NYSE:MSA). Given that stock prices are usually driven by a company’s fundamentals over the long term, which in this case look pretty weak, we decided to study the company's key financial indicators. Specifically, we decided to study MSA Safety's ROE in this article.
Return on Equity or ROE is a test of how effectively a company is growing its value and managing investors’ money. Put another way, it reveals the company's success at turning shareholder investments into profits.
How Is ROE Calculated?
Return on equity can be calculated by using the formula:
Return on Equity = Net Profit (from continuing operations) ÷ Shareholders' Equity
So, based on the above formula, the ROE for MSA Safety is:
5.1% = US$43m ÷ US$838m (Based on the trailing twelve months to June 2022).
The 'return' is the yearly profit. Another way to think of that is that for every $1 worth of equity, the company was able to earn $0.05 in profit.
Why Is ROE Important For Earnings Growth?
So far, we've learned that ROE is a measure of a company's profitability. We now need to evaluate how much profit the company reinvests or "retains" for future growth which then gives us an idea about the growth potential of the company. Generally speaking, other things being equal, firms with a high return on equity and profit retention, have a higher growth rate than firms that don’t share these attributes.
MSA Safety's Earnings Growth And 5.1% ROE
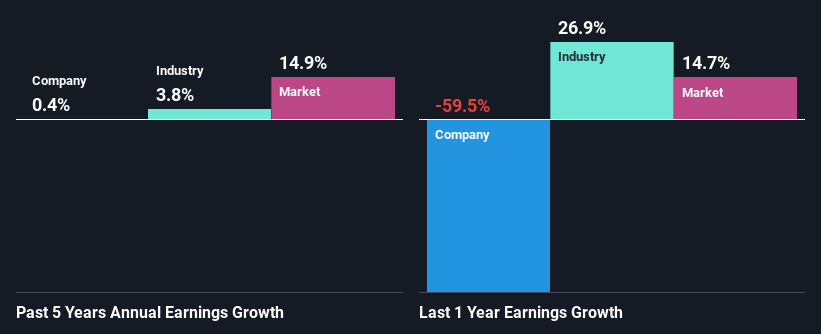
On the face of it, MSA Safety's ROE is not much to talk about. Next, when compared to the average industry ROE of 12%, the company's ROE leaves us feeling even less enthusiastic. Hence, the flat earnings seen by MSA Safety over the past five years could probably be the result of it having a lower ROE.
We then compared MSA Safety's net income growth with the industry and found that the company's growth figure is lower than the average industry growth rate of 3.8% in the same period, which is a bit concerning.
Earnings growth is a huge factor in stock valuation. It’s important for an investor to know whether the market has priced in the company's expected earnings growth (or decline). By doing so, they will have an idea if the stock is headed into clear blue waters or if swampy waters await. One good indicator of expected earnings growth is the P/E ratio which determines the price the market is willing to pay for a stock based on its earnings prospects. So, you may want to check if MSA Safety is trading on a high P/E or a low P/E, relative to its industry.
Is MSA Safety Using Its Retained Earnings Effectively?
With a high three-year median payout ratio of 54% (implying that the company keeps only 46% of its income) of its business to reinvest into its business), most of MSA Safety's profits are being paid to shareholders, which explains the absence of growth in earnings.
Moreover, MSA Safety has been paying dividends for at least ten years or more suggesting that management must have perceived that the shareholders prefer dividends over earnings growth.
Conclusion
In total, we would have a hard think before deciding on any investment action concerning MSA Safety. As a result of its low ROE and lack of much reinvestment into the business, the company has seen a disappointing earnings growth rate. Having said that, looking at the current analyst estimates, we found that the company's earnings are expected to gain momentum. To know more about the company's future earnings growth forecasts take a look at this free report on analyst forecasts for the company to find out more.
Have feedback on this article? Concerned about the content? Get in touch with us directly. Alternatively, email editorial-team (at) simplywallst.com.
This article by Simply Wall St is general in nature. We provide commentary based on historical data and analyst forecasts only using an unbiased methodology and our articles are not intended to be financial advice. It does not constitute a recommendation to buy or sell any stock, and does not take account of your objectives, or your financial situation. We aim to bring you long-term focused analysis driven by fundamental data. Note that our analysis may not factor in the latest price-sensitive company announcements or qualitative material. Simply Wall St has no position in any stocks mentioned.
The views and opinions expressed herein are the views and opinions of the author and do not necessarily reflect those of Nasdaq, Inc.

