
By buying an index fund, you can roughly match the market return with ease. But if you choose individual stocks with prowess, you can make superior returns. For example, the Flex Ltd. (NASDAQ:FLEX) share price is up 91% in the last three years, clearly besting the market return of around 45% (not including dividends). On the other hand, the returns haven't been quite so good recently, with shareholders up just 4.9%.
Let's take a look at the underlying fundamentals over the longer term, and see if they've been consistent with shareholders returns.
While markets are a powerful pricing mechanism, share prices reflect investor sentiment, not just underlying business performance. By comparing earnings per share (EPS) and share price changes over time, we can get a feel for how investor attitudes to a company have morphed over time.
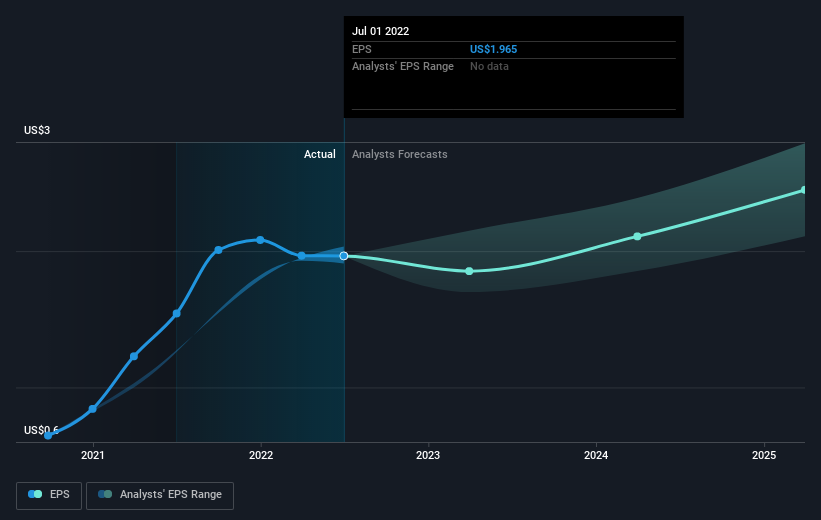
Flex was able to grow its EPS at 262% per year over three years, sending the share price higher. This EPS growth is higher than the 24% average annual increase in the share price. So one could reasonably conclude that the market has cooled on the stock. This cautious sentiment is reflected in its (fairly low) P/E ratio of 9.21.
The graphic below depicts how EPS has changed over time (unveil the exact values by clicking on the image).
We know that Flex has improved its bottom line over the last three years, but what does the future have in store? You can see how its balance sheet has strengthened (or weakened) over time in this free interactive graphic.
A Different Perspective
We're pleased to report that Flex shareholders have received a total shareholder return of 4.9% over one year. Since the one-year TSR is better than the five-year TSR (the latter coming in at 3% per year), it would seem that the stock's performance has improved in recent times. In the best case scenario, this may hint at some real business momentum, implying that now could be a great time to delve deeper. While it is well worth considering the different impacts that market conditions can have on the share price, there are other factors that are even more important. Case in point: We've spotted 1 warning sign for Flex you should be aware of.
But note: Flex may not be the best stock to buy. So take a peek at this free list of interesting companies with past earnings growth (and further growth forecast).
Please note, the market returns quoted in this article reflect the market weighted average returns of stocks that currently trade on US exchanges.
Have feedback on this article? Concerned about the content? Get in touch with us directly. Alternatively, email editorial-team (at) simplywallst.com.
This article by Simply Wall St is general in nature. We provide commentary based on historical data and analyst forecasts only using an unbiased methodology and our articles are not intended to be financial advice. It does not constitute a recommendation to buy or sell any stock, and does not take account of your objectives, or your financial situation. We aim to bring you long-term focused analysis driven by fundamental data. Note that our analysis may not factor in the latest price-sensitive company announcements or qualitative material. Simply Wall St has no position in any stocks mentioned.
The views and opinions expressed herein are the views and opinions of the author and do not necessarily reflect those of Nasdaq, Inc.

