The following article is originally published in the April 2011 edition of ISM™ (Institute for Supply Management™) eDigest: Chemicals
Energy Commodities Forecasting
Establishing an intelligence network gives you a competitive edge
By Dian L. Chu, CPSM, C.P.M.
In recent years, there has been a great deal of instability in the price of energy sources and basic feedstocks, including oil and natural gas. This volatility is the result of tight supply resulting from changes in global demand. It has prompted companies to place more emphasis on supply chain market intelligence (MI), as well as on business intelligence (BI).
Institute for Supply Management™ (ISM) defines MI in supply management as "the process and the result of gathering and analyzing information about the aggregate forces (including economics) at work in trade and commerce in a specific service and commodity."
In other words, MI looks at all external factors and forces affecting a corporation's supply chain.
Wikipedia defines BI as "computer-based techniques used in spotting, digging out and analyzing business data, such as sales revenue by products and/or departments, or by associated costs and incomes."
So, BI technologies examine internal data to provide historical, current and predictive views of business operations.
Business Intelligence in Practice
Let me elaborate a little more on BI from a practical standpoint.
Nowadays, most corporations have an enterprise resource planning (ERP) system, such as SAP, to house all internal financial and planning information such as income, expense, budget and demand forecasting — all of which is part of the BI system.
In practice, another part of BI also involves data warehouse software — MicroStrategy, for example — to extract relevant data out of the massive ERP system.
For supply management purposes, BI also typically requires certain mapping mechanisms to relate the data extracted from the ERP system to provide meaningful information that can be used, such as on a category level. For example, certain accounting accounts, codes or material codes, in the ERP system (for example, pens, pencils, papers, and so on) may be grouped into one single category (office supplies) to provide a summarized, yet relevant, view of the historical and planned activities of an organization.
This BI process would help prioritize supply chain efforts based on the business plan and supplier relationship, among many other internal parameters. The decision and planning process typically occurs on a yearly basis (assuming business as usual) to support organizational and departmental goals, and objectives and budgets, and might involve stakeholders from outside the supply management function.
An integrated approach combining MI and BI in decision-making helps organizations manage market risks and volatility with a new level of effectiveness.
A Chemical Example
To better illustrate this integrated approach, consider an example of a company with three major spend categories — chemical, construction materials and contingent labor. First, let's look at BI.
Post-"Great Recession," the world economy is on the verge of roaring back, led mostly by emerging economies, including China and India. As such, during the yearly BI process for 2011 — and after taking into account that the macroeconomic recovery is underway — organizations should have been able to identify major and priority sourcing categories.
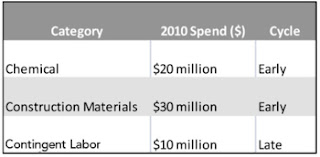
In this example, "chemical" (US$20 million) and "construction materials" (US$30 million) are classified as two of the major spend categories.
Based on historical industry and sector trends, market intelligence (MI) also indicates that prices and demand of these two categories rise and fall more quickly with the general economic condition (in this example, a recovery) compared with contingent labor, as shown. This identifies the "chemical" and "construction materials" categories as early-cycle.
In contrast, demand and pricing of contingent labor services tend to stay relatively stable throughout the ups and downs in a particular economic cycle. As such, contingent labor is designated as a late-cycle category in the aforementioned example.
Midcycle designations (not shown) could be assigned to categories that are less susceptible to marketplace changes than early-cycle categories, but more so than late-cycle ones. Such marketplace changes might include recessions, economic recoveries and even geopolitical events.
Tagging each major and priority category as early-, mid- or late-cycle, as part of the MI process — with each designation backed up by BI data — provides a timing framework to help prioritize these categories. This practice also helps resource allocation in the event of a change in market conditions — again, for example, recession, recovery and/or geopolitical events.
In the example offered earlier, the resulting recommendation — based on the network of BI and MI — would be for supply management professionals to focus very early on working with chemical suppliers (versus with contingent labor suppliers) to secure supplies, as well as pricing. An economic recovery would tend to drive up chemical prices and demand, causing price spikes and supply shortages.
Using the information mapped out in the chart above, supply chain professionals would devise a tactical plan that places priority on the early-cycle categories — in this case, chemicals and construction materials. Meanwhile, late-cycle categories — such as contingent labor, as shown — are assigned a later date in the project time line to better allocate personnel and other internal resources.
Market Intelligence - Macro Trend
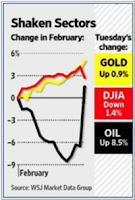
Now, also as part of the MI process, the recent macroeconomic trend pertaining to the chemical sector could be summarized as follows: Faster global growth has been pushing up raw material prices, and the gains in oil accelerated after riots breaking out in Egypt and Tunisia, and are threatened in Libya. (See graphic at right.)
Meanwhile, crude's straight ascent also has driven the U.S. oil-to-natural gas price ratio close to 25:1 in recent months, nearing an historic 11-year high of 27:1 in 2009.
As long as the situation in the Middle East and North Africa remains volatile and unresolved, markets will keep adding a "fear premium" to crude oil and associated products, whereas natural gas is basically in the doldrums trapped within the U.S., with a rising glut of inventory. Additionally, most analysts predict U.S. natural gas prices will remain mostly flat for the next three to five years.
Feed Stock Implication
For the chemical industry, this latest natural gas price trend means long-term, less expensive ethane. This will give U.S. players a feedstock cost advantage, compared with their peers in Asia and Europe, which use more naphtha.
Because natural gas prices in Europe and Asia are more directly linked to oil than those in the United States — and with crude oil supply and price becoming increasingly volatile — coal now appears to offer more reliability and less supply risk. This could drive the development of coal-to-chemicals technologies.
Around the world, meanwhile, government environmental regulations and renewable energy incentives have ramped up the commercialization of renewable-resource-based chemical feedstocks. Major players Dow Chemical (DOW) and Dupont (DD) are already actively involved in the production of biofeedstock-based bulk chemicals.
Supplier Market Intelligence
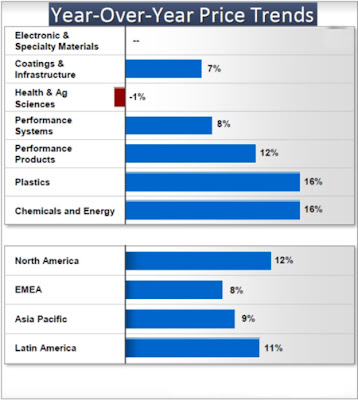
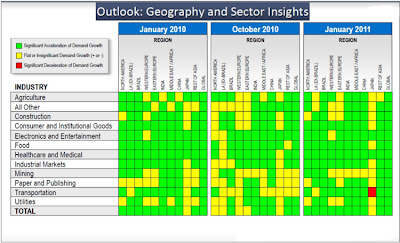
Reviewing supplier market intelligence would reveal information such as pricing and a sector trend from a supplier's perspective (see the two charts below), as well as pricing trends based on a third-party benchmark — indexes from the Bureau of Labor Statistics, for instance.
Furthermore, MI analysis would identify the major chemical suppliers with pertinent information (such as market shares, average margins and more), and that different sectors and regions have different pricing power.
For instance, because I have some oil and gas industry experience, I've learned that the energy industry (oil, gas, power generation and so on) requires specialty chemicals for very specific applications, but represents a relatively small portion of the chemical company's total revenues. As such, the energy sector typically does not have as much pricing power as other heavier end users, such as the fertilizer companies like Monsanto (MON) and Mosaic (MOS).
Putting It All Together
Incorporating analysis from BI and MI into the decision-making process could result in a supply management action plan, such as working with U.S.-based suppliers early in an economic recovery cycle to secure supplies and/or the establishment of a firm, index-based pricing structure.
Also, using the industry trend identified by MI, supply management professionals can form a strategic plan to start incorporating alternative technologies of coal-to-chemicals and biofeedstocks into the supply chain.
Staying Ahead
Market volatility affects the profitability and competitiveness of many companies, and is expected to intensify due to a synchronized global recovery after the Great Recession. Eventually, the goal of the intelligence network discussed in this article would be to create a better understanding of a corporation's current and future resource allocation, as well as relevant aspects of the market — including supply-and-demand trends and supplier dynamics — using thorough research and analysis.
This integrated approach of combining MI and BI helps companies stay nimble and take advantage of market opportunities to stay ahead of the curve.
This article is originally published in the April 2011 edition of ISM™ eDigest: Chemicals.
EconMatters, April 15, 2011 | Facebook Page | Post Alert | Kindle
The views and opinions expressed herein are the views and opinions of the author and do not necessarily reflect those of Nasdaq, Inc.
The views and opinions expressed herein are the views and opinions of the author and do not necessarily reflect those of Nasdaq, Inc.
 Credit: Shutterstock photo


