News & Insights


Last year, we saw continued improvement in the initial public offering (IPO) market. There were more IPOs, more special purpose acquisition companies (SPACs), and IPOs raised more money than in both 2022 and 2023.
A number of factors aligned. Firstly, with inflation falling back to around 2%, interest rates started to fall. In addition, volatility was lower than 2022 and 2023. That helped markets rally to all-time highs on higher valuations (Chart 1, purple line, CAPE increased to 2021 levels), which, in turn, helps improve overall positive investor sentiment. These are all factors our IPO Pulse shows are important for a stronger IPO market.
But looking at the data, we see a consistent improvement in not only the number of IPOs but also their returns as we head into 2025.
An uptick in the number of IPOs
In the chart below, we use data from Jay Ritter, a well know IPO academic with a long history of activity.
His data shows a total of 221 U.S. equity market IPOs in 2024, an increase from the 151 IPOs in 2023 and 178 IPOs in 2022. To be fair, we’re still significantly below the 2021 high of 1,028, but the IPO market is definitely rebounding.
Importantly, Ritter counts American depositary receipts (ADRs), companies with an IPO price under $5, SPACs, REITs, banks, unit offers, and partnerships or trusts in the “other” (light green) category. ETFs aren’t included in the Chart 1 analysis.
Chart 1: New IPOs rebounded in 2024

Falling rates coincided with more IPOs as the year progressed
Recall in 2023, we reached peak rates with increases paused after July 2023. By September of 2024, the Federal Reserve began rate cuts with a 50 basis points (bps) decrease in September and 25bps decreases in both November and December. In total, by the end of the year the federal funds rate decreased a full percent from 2024 highs.
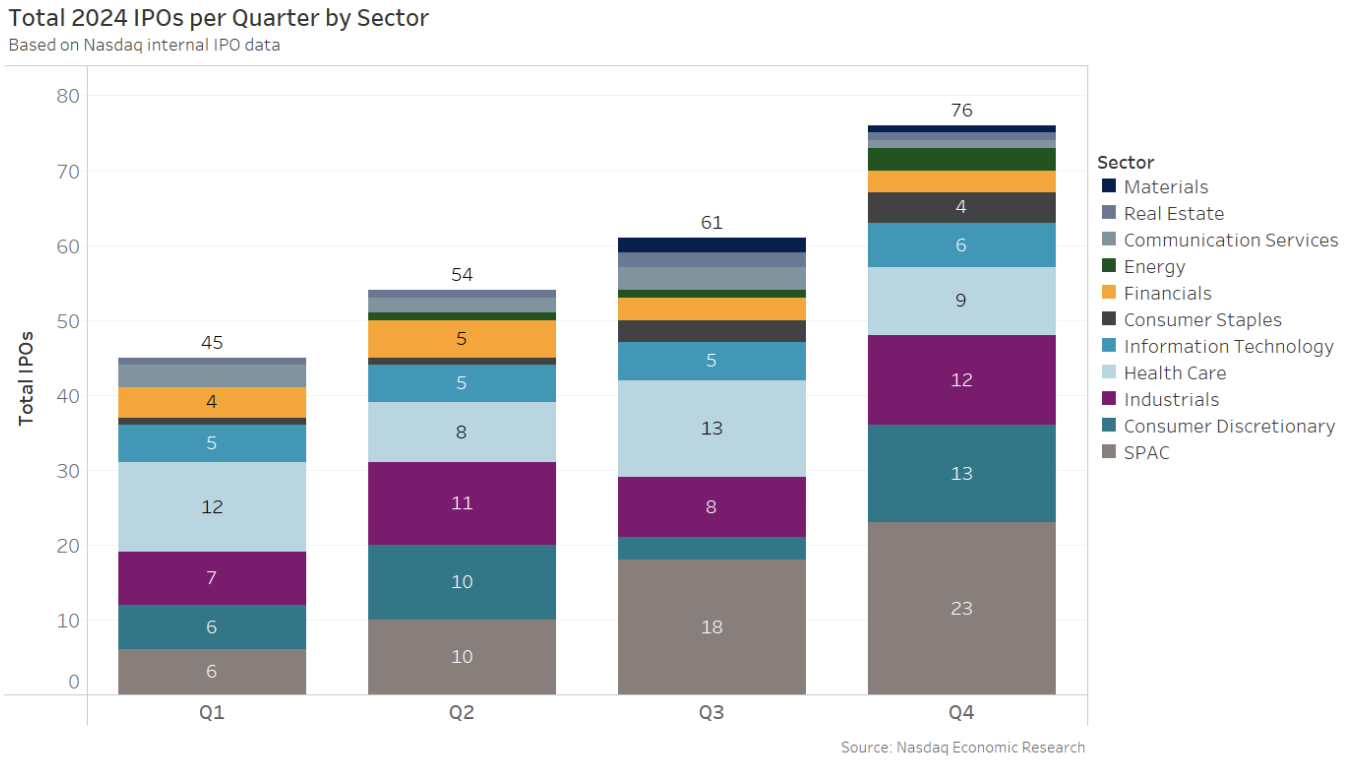
The IPO market reacted to better interest rate expectations with more IPOs quarter over quarter, topping out at 76 in Q4 (or October – December). Chart 2 shows:
- A consistent increase in IPOs each quarter.
- A broadening of IPOs into most sectors. In fact, 10 of the 11 GICS sectors saw an IPO in Q4 of 2024.
- Interestingly, only the utilities sector did not see an IPO in 2024. Although, with all the discussions around the power needs for AI data centers, maybe we will see a Utilities IPO in 2025.
Chart 2: IPOs increased each quarter in 2024
2024 IPOs Raised $30 billion
Capital raising also significantly increased compared to the prior two years. IPOs (excluding SPACs) in 2024 raised $10 billion more in capital than 2023, and $24 billion more than in 2022.
The majority (73%) of new IPOs also chose Nasdaq for their new home, with total capital raised by those listings of $15.8 billion.
Chart 3: Capital raised in IPOs increases

Unicorns are no longer special
Notably, 14 IPOs reached a day-one market cap over $5 billion, and five companies raised over $1 billion in their offering – a number once thought so large they were dubbed “unicorn” IPOs.
The largest new listing in 2024 was Lineage, Inc. (LINE), which provides temperature-controlled warehouse services and is headquartered in Michigan. It had the biggest offer raise of 2024 at $4.4 billion and reached a day-one market cap of $16.9 billion.
Other large notable IPOs included:
- KSPI – with a $92 IPO price, KSPI had the largest first day market cap of 2024 at $18.1 billion and the highest IPO price of the year. KSPI (Kaspi.kz AO) is a Kazakhstani company that operates payment, marketplace and fintech platforms.
In fact, over 90 foreign companies had U.S. IPOs in 2024. That contributed to the trend of foreign issuers choosing U.S. markets, likely thanks to U.S. markets’ higher liquidity and lower cost of capital.
Day-one returns were mostly positive again
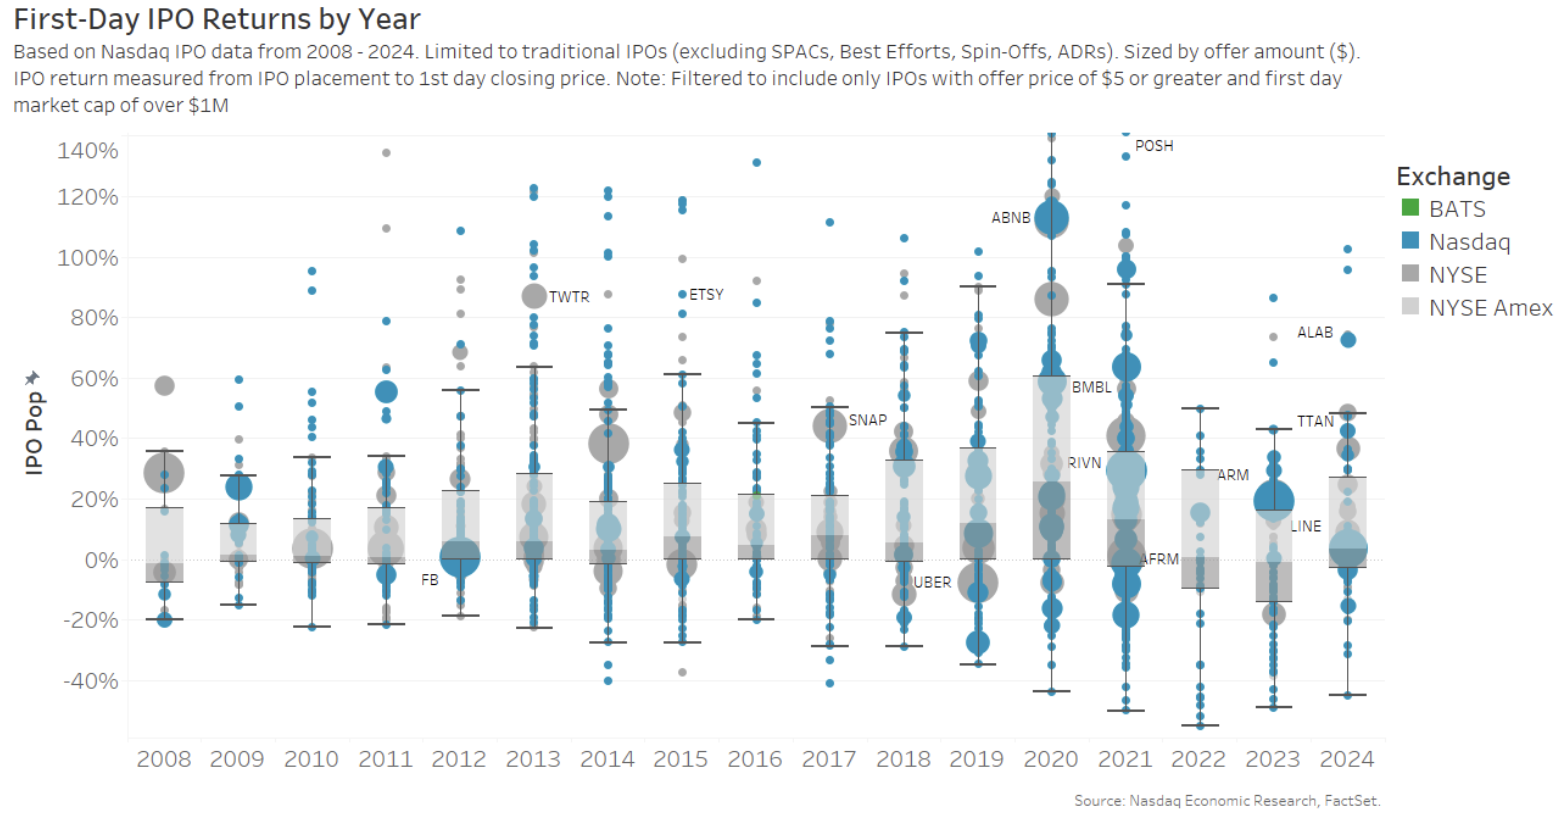
Chart 4 below shows the 2024 median day-one IPO return (sometimes called the “IPO pop”). This measures a stock’s return from the overnight institutional placement price to the close on the first day of trading.
Not all IPOs go up – but 2024 looked much more like most of the prior decade. Another sign that the IPO market (and investor sentiment) is improving. In fact, we see:
- 64% of companies had positive day-one returns.
- 36% of companies even had an IPO pop of over 10%.
- Ritter’s data saw the average IPO pop improve in 2024 to 15.3%.
That compares well to 2022 and 2023, when the median IPO pop was essentially zero (seen by the darker grey box falling below the axis), and looks familiar to the recovery from the Financial Crisis in 2008-2009.
Although, again, we aren’t near the highs of 2020 and 2021, where it was common to see a day-one return of 30% or more.
Chart 4: IPO first-day returns distribution
Longer-term returns were stronger than 2021-2023
For buy and hold investors, 2024 IPOs' long-term returns also improved, especially compared to the past few years.
Median returns three months post IPO 2024 performance (the green line in Chart 5) were much better than the last two years (purple and pink lines). Importantly, 2024 IPOs as a group have so far held their day-one gains throughout the year. However, we’d note that newer 2024 IPOs won’t count yet for in the longer periods of returns.
Chart 5: 2024 IPOs performed better in the long run than the last three years

Unicorns boosted average returns
Overall, 2024 IPOs had an average return of 32% (the green line in Chart 6). However, as the chart also shows, larger IPOs tended to perform better than smaller IPOs. In fact, the majority of unicorns (on the right) are ahead of their IPO price, which can’t be said for smaller companies (on the left).
Chart 6: The biggest 2024 outperformers saw 200%+ returns at year-end
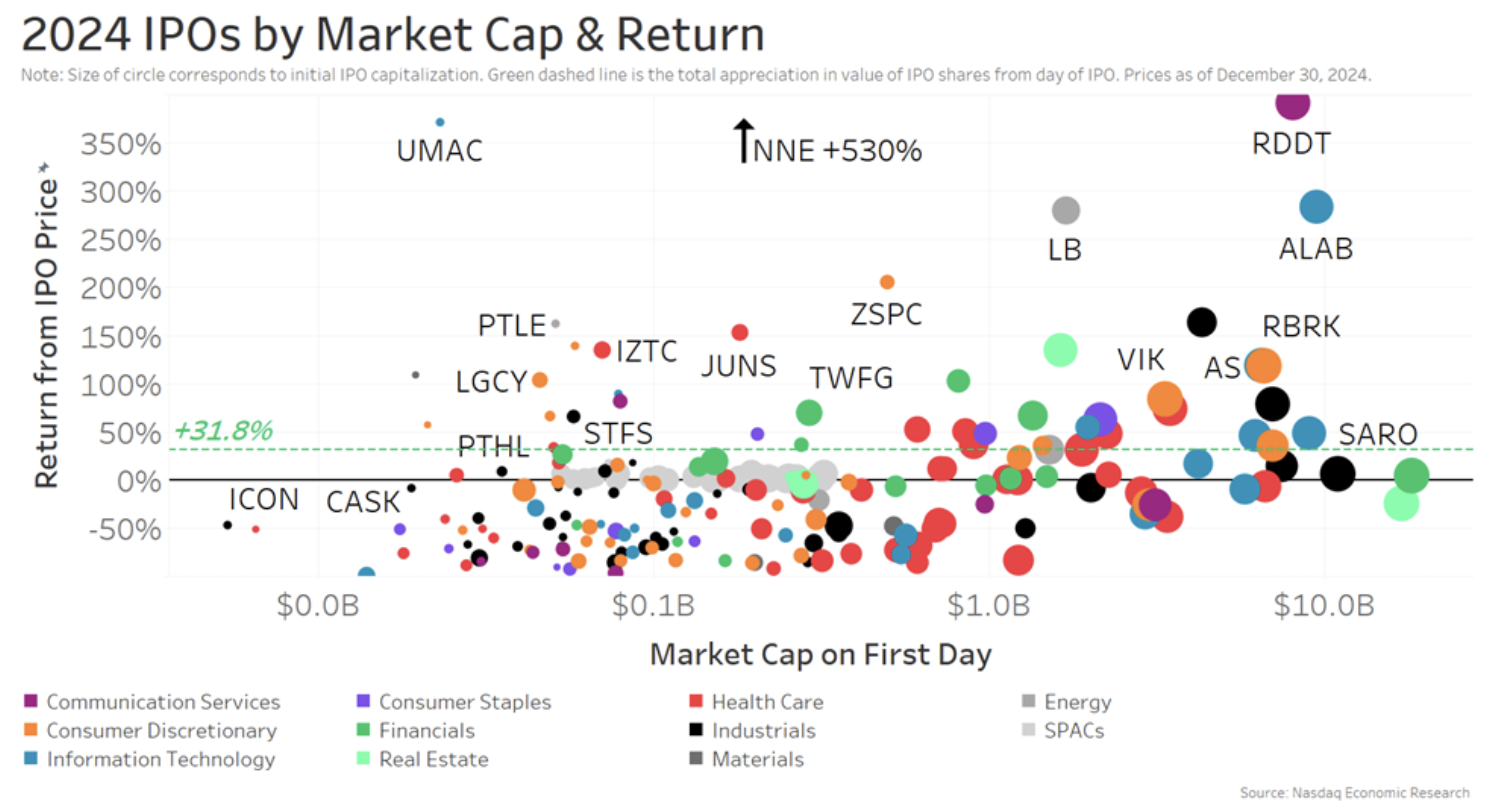
We also color the chart by sector and size by capital raise. That helps show that some sectors fared better than others.
- Real estate companies (light green) saw the best year with 76% average returns by year-end.
- Energy (grey dots) companies also fared quite well with 24% average returns.
- Consumer staples (purple) saw the lowest average returns with -30% by Dec. 31.
We also see different demand for capital across sectors:
- The Health Care sector (size of the red dots in Chart 6) outraised all the other sectors during the year with a total raise of $7.5 billion, but it also had the most IPOs at 42.
- Real estate (size of the light green dots) saw the largest raise per company, with $1.1 billion.
- Materials companies (dark grey) saw the smallest raise per company, with only $44 million total raised across all materials IPOs.
SPACs saw a rebound in 2024
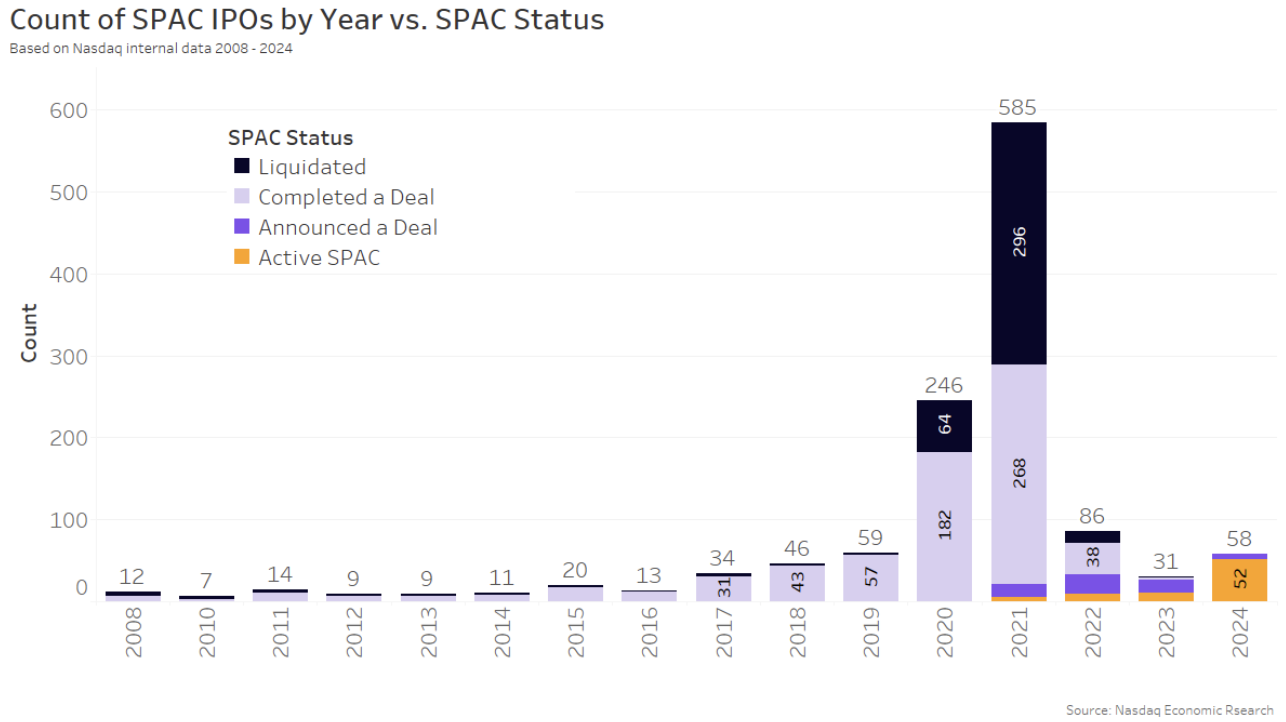
While the SPAC craze of 2020 and 2021 certainly seems over, new active SPACs are still listing. In 2024, 58 new SPACs listed, six have announced a deal so far, and 52 are still active.
But a number of SPACs from 2021 have also liquidated – and only 46% of them have completed a deal.
Just a few older SPACs are still active and looking for a deal (orange bars), with 20 from 2022 and 2023 combined.
Chart 7: New SPAC listings rebounded in 2024
While SPACs are not back to 2021 sizes, they did raise significantly larger capital in 2024. The median SPAC (Chart 8) increased to $168 million, slightly below the 2021 median of $220 million and well above the 2023 $60 million.
However, the size of the SPACs is still much smaller than most of the last decade, looking at the grey boxes in Chart 8 for 2016-2021, as all are higher than the 2024 box.
Chart 8: 2024 SPACS raised significantly more capital than 2023

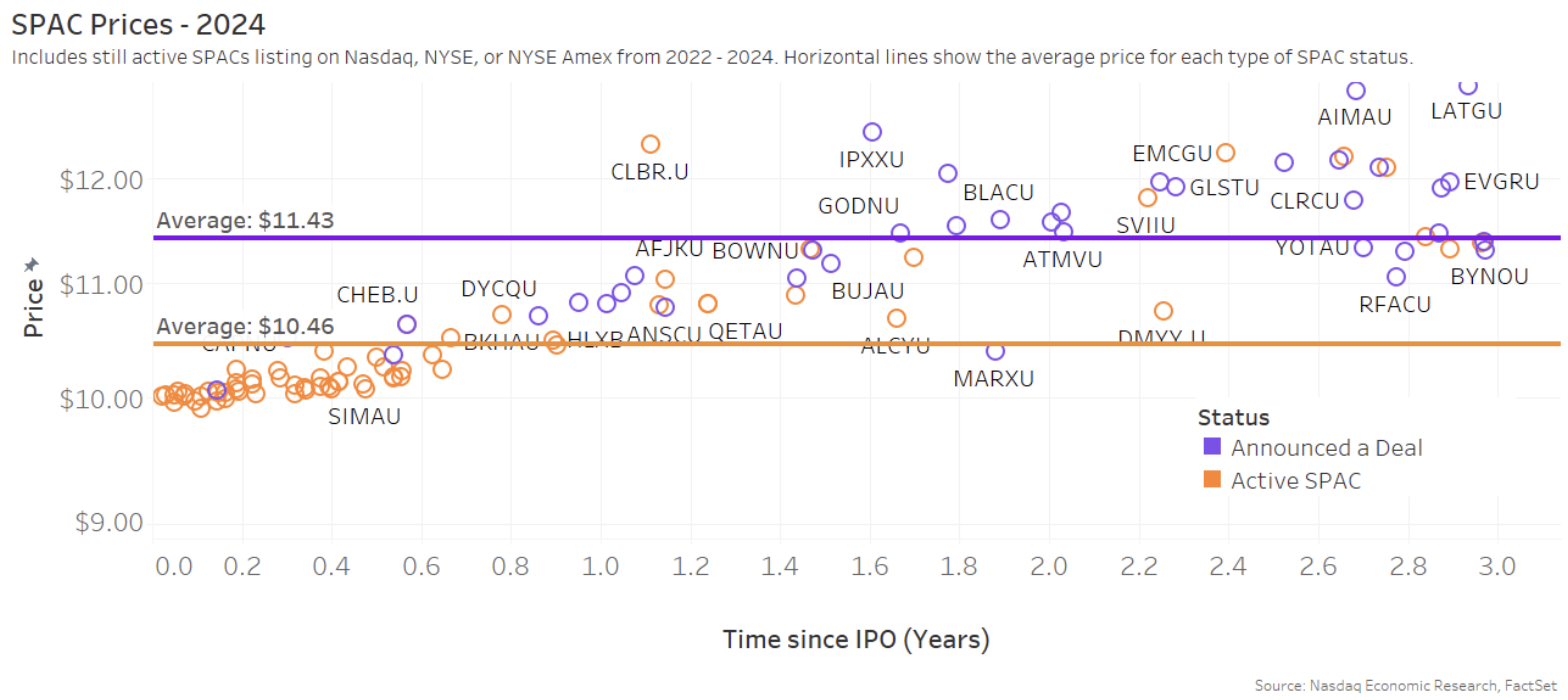
SPAC prices still around $10
No active SPAC is trading below $9.92, with the average active SPAC trading at $10.46. The majority of active SPACs are clustered at exactly $10 (the orange circles on the left side of Chart 9).
SPACs that have announced a deal are trading at almost a dollar more with an average price of $11.43 and none are trading below $10.07. Active SPACs are taking one to three years to find a deal, with around half taking two to three. Typically, SPACs give themselves a two-year period to find and complete a de-SPAC and sometimes three, this is why a lot of the 2021 SPACs that did not find a deal have liquidated in Chart 7.
Chart 9: Active SPAC prices held at around $10
Overall, the IPO data is looking better
Last year, all IPO metrics improved, signaling the IPO market is certainly on the rebound. We saw better day-one returns, longer positive returns post-IPO, more capital raised and more IPOs throughout the year than in 2022 and 2023.
The significant IPO improvements in 2024 should continue into 2025. We wrote two weeks ago that in 2024 the U.S. led the world in new IPOs, and we think the IPO revival is likely to continue into 2025.
Nicole Torskiy, Economic & Statistical Research Senior Specialist, contributed to this article.
Market Makers Newsletter
Get market insights and analysis from Nasdaq Chief Economist Phil Mackintosh straight to your inbox
Latest articles

This data feed is not available at this time.
Data is currently not available