
 Credit: Shutterstock photo
ByNewfound Research:
In March 2012, Russell Investments published an article titled "The making of a better benchmark." The article explores the uses of benchmarks in the financial markets and from these uses argues for a set of criteria that appropriate benchmarks should meet. The author states that the best benchmarks:
- are float adjusted
- are capitalization weighted
- exclude constituents lacking enough liquidity to be traded by the market in a cost-effective manner
In our view, benchmarks are used for two distinct purposes: (1) as market standards and (2) as tools to evaluate the performance of active managers. The appropriate benchmark is dependent on which of these two categories best fits a given situation.
The argument for float adjusted, capitalization weighted indices in the former case is strong. As a thought experiment, imagine if the S&P 500 were equal weighted. The investable capacity of the index would be reduced from more than $13 trillion to approximately $1 trillion. This would have far-reaching negative effects on the efficiency of the financial markets. For example, the size of derivatives markets tied to the S&P 500, would be dramatically reduced because the ability to put on hedges would be constrained.
However, the argument breaks down in the latter case of evaluating active managers. Active managers, even within narrow sub-asset classes, employ a wide array of strategies. The benchmark used to evaluate these managers, cannot be generic. Instead, they must be customized in order to isolate the true value added by that manger.
An example can best illustrate the importance of customizing benchmarks to evaluate performance. Assume that you are a financial advisor and a quantitative manager comes into your office. The manager says that his firm has a quantitative model* that can rank the attractiveness of single country equity ETFs . He is pitching a strategy where he looks at the top 10 market cap foreign developed countries (United Kingdom ( EWU ), Japan ( EWJ ), Switzerland ( EWL ), Australia ( EWA ), France ( EWQ ), Germany (EWG), Sweden (EWD), Hong Kong (EWH), Spain (EWP) and Netherlands (EWN)). He will rank the 10 countries in terms of attractiveness, eliminate the two least attractive countries, and then invest equally in the remaining eight countries.
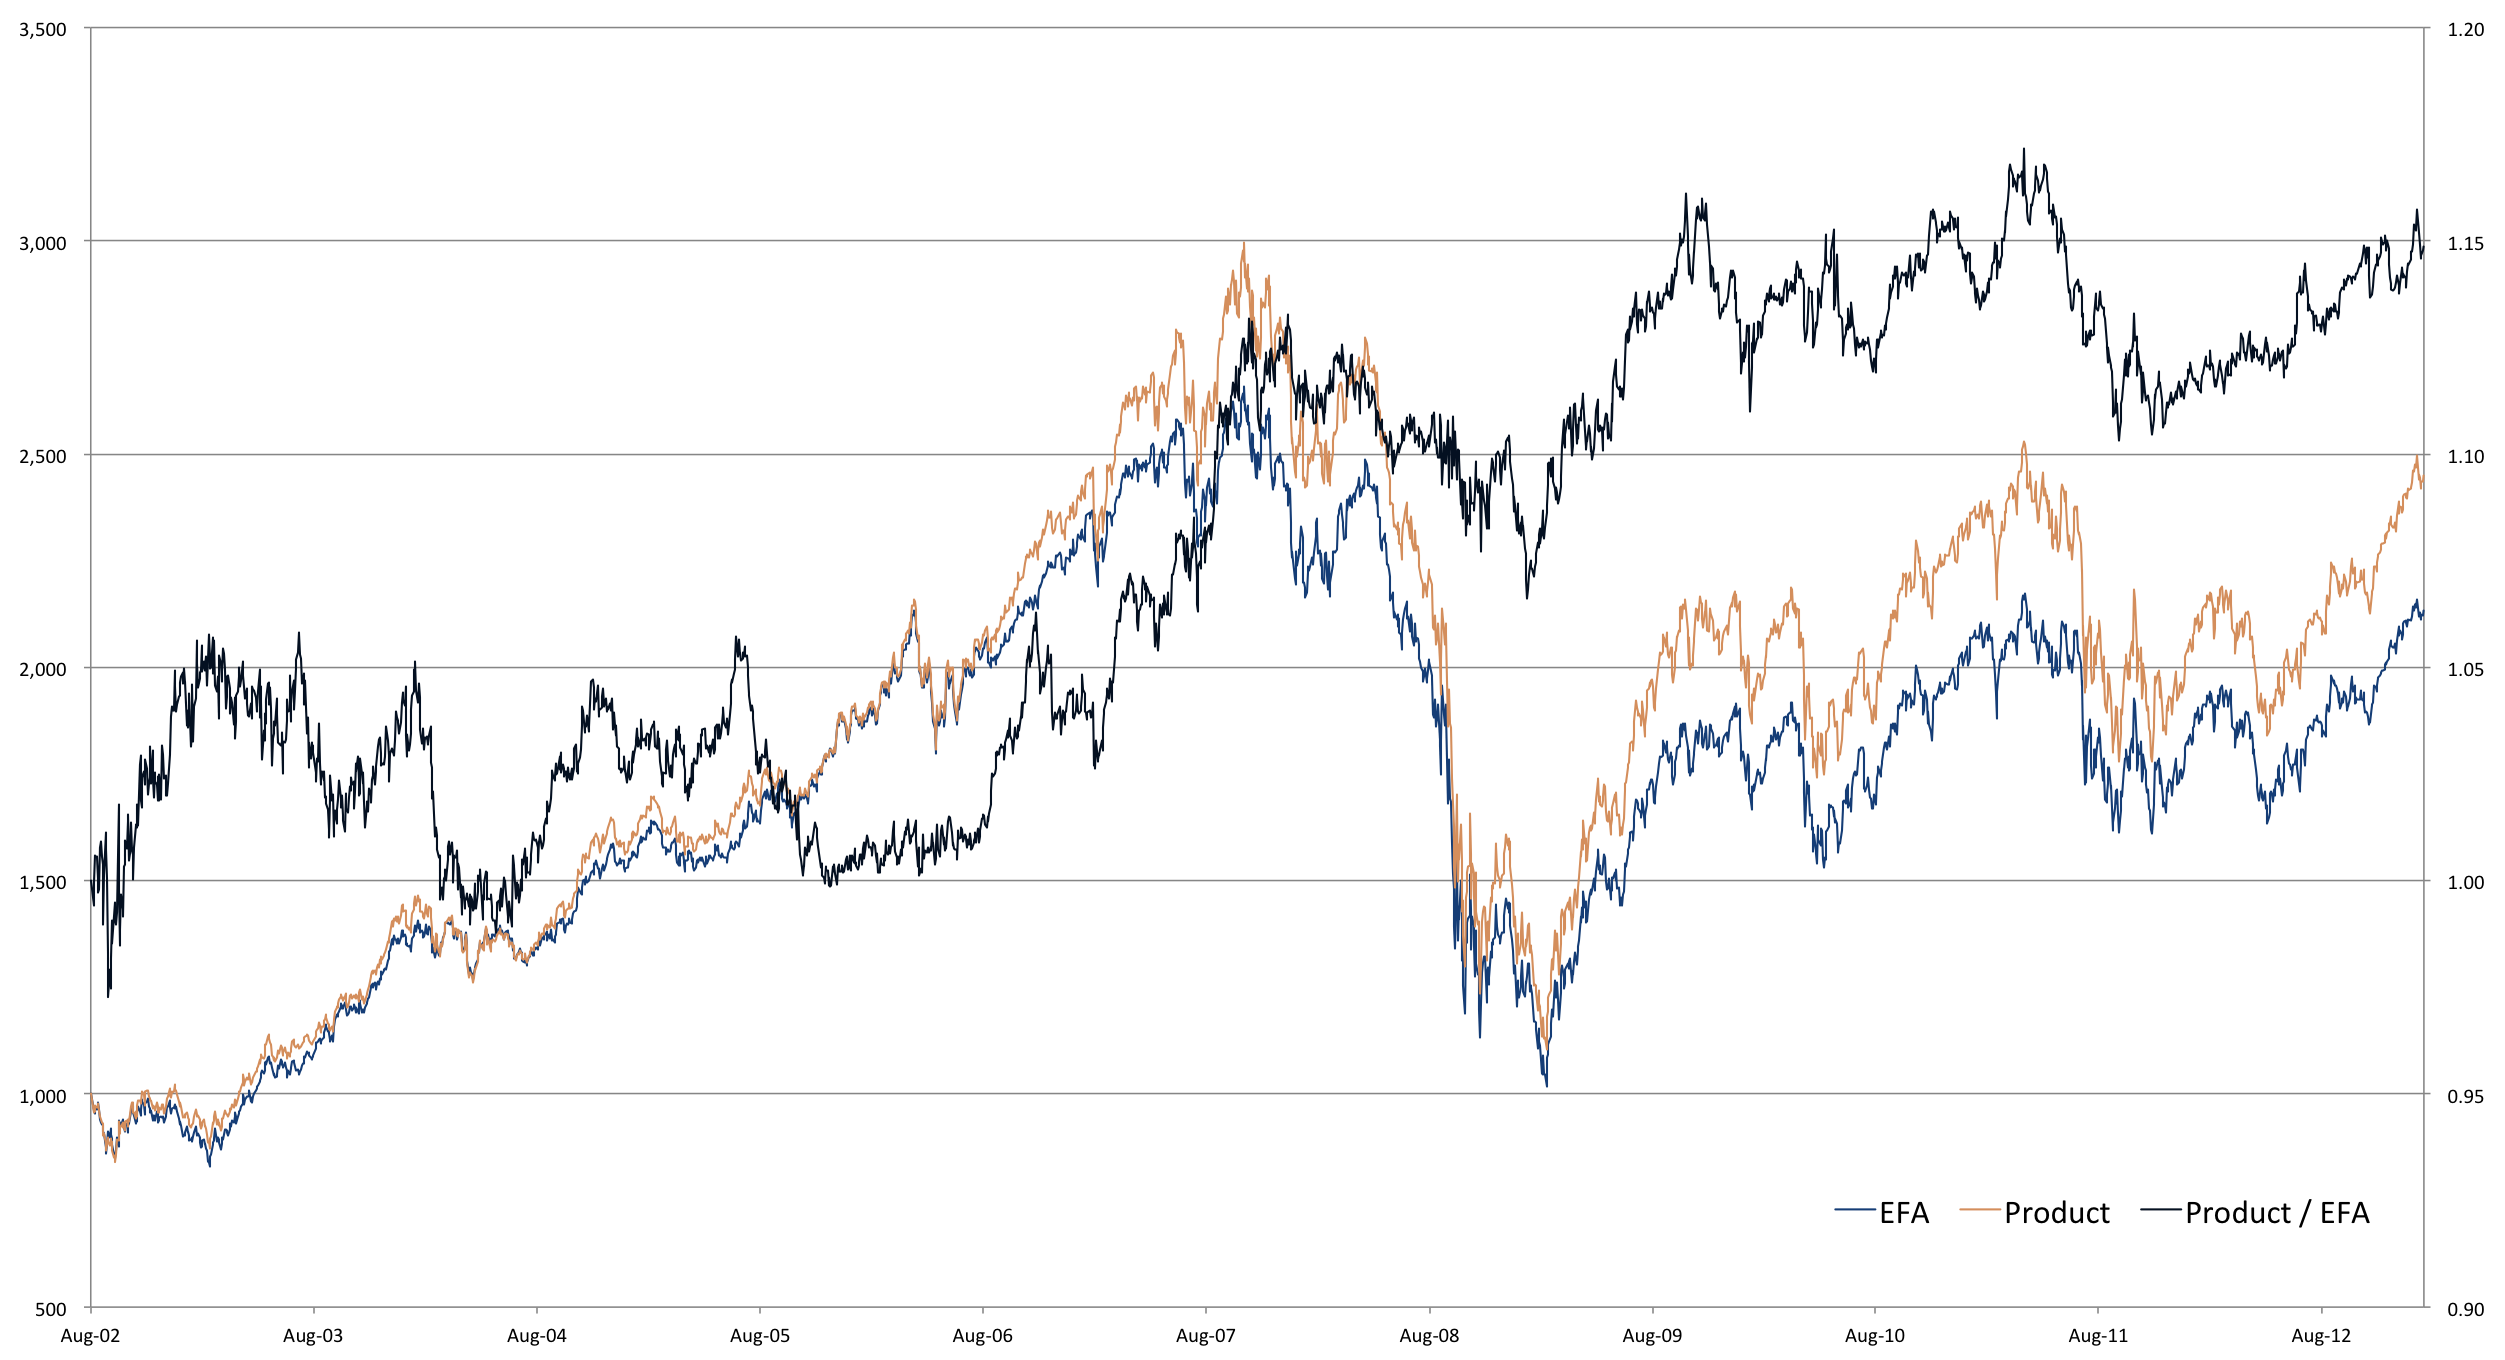
The following chart plots the performance of the manager's strategy ("Product") vs. iShares MSCI EAFE Index (EFA) (tracks the MSCI EAFE Index and would be considered the traditional benchmark). The manager points out that the strategy offers a historical Sharpe Ratio of 0.24, a 21.6% improvement over the 0.20 Sharpe Ratio of EFA. In addition, he states that the strategy added 1.5% of alpha annually. He says that this performance vs. the index illustrates the power of his quantitative model and makes investing in the strategy a no brainer.
Performance vs. EFA
The manager's pitch rests heavily on the selection of EFA as the benchmark since all of his sales points relate to the strong performance of his product relative to EFA. Therefore, evaluating the strategy largely boils down to whether EFA is the appropriate benchmark.
The following table presents average portfolio weight by country for the product, EFA and a static, equally weighted portfolio of the 10 eligible ETFs. EFA fails as an appropriate benchmark in a number of respects:
- United Kingdom and Japan significantly overweighted in EFA vs. product
- Sweden, Hong Kong, Spain and Netherlands significantly underweighted in EFA vs. product
- More than 10% of EFA's holdings are in countries not eligible for inclusion in the product
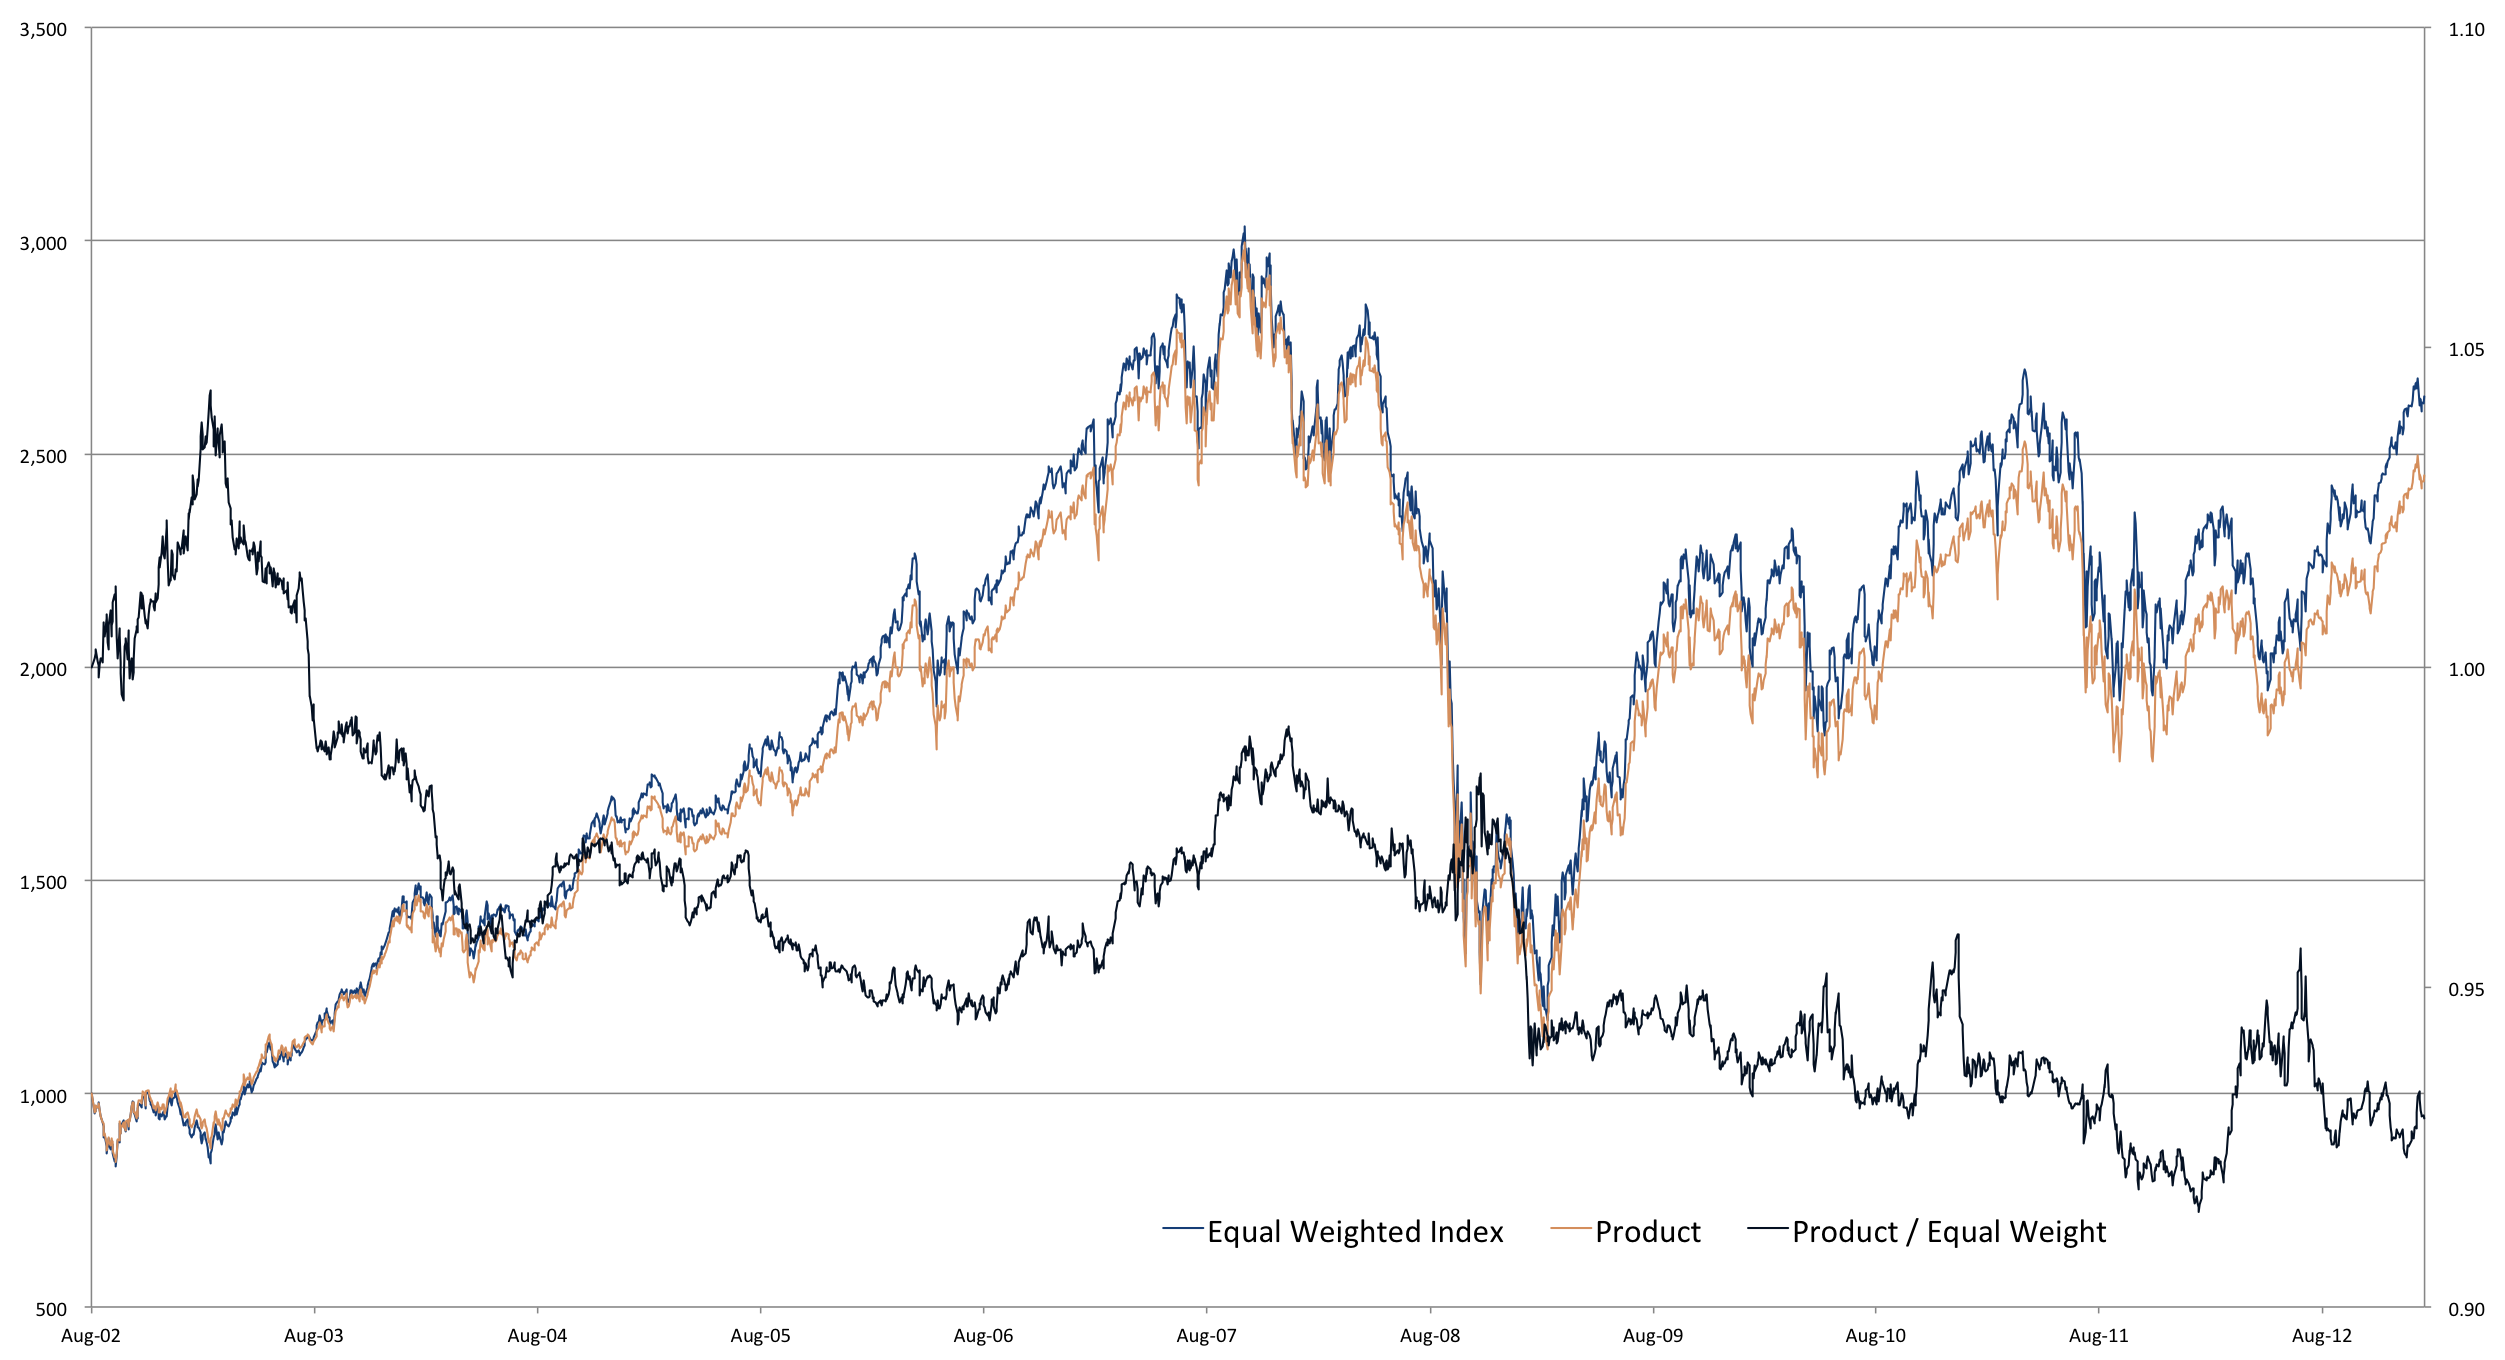
The custom equal weighted benchmark is the more accurate benchmark to use in evaluating whether or not to invest in this product. The following chart presents performance of the manager's strategy vs. this new benchmark. The strategy now looks a lot less appealing. The Sharpe Ratio has actually decreased by 8.4% from 0.26 to 0.24 and the manager has underperformed by 64bps annually on a risk-adjusted basis. The advisor would be much better off investing directly in the equal-weighted benchmark and paying the 53bps management fee on the ETFs instead of investing with the manager and paying not only the 53bps on the ETFs but also the manager's fee.
Performance vs. Equal-Weighted Benchmark
Takeaways
When evaluating potential investments, it is crucial to ask tough questions about why a manager decided to use a particular benchmark. One of the best data points to consider is how historical allocations over a full market cycle compare to allocations in the benchmark. Large deviations between these two sets of weights are a signal that further exploration into the selection of the benchmark is needed. The average weight benchmark is a good way to test whether a manager has just data-mined (or stumbled upon) a good set of weights that worked historically or if his tactical decisions added value
Note, however, that there may be good reasons why a benchmark with different long-term allocations is appropriate. Consider a couple in their 70s who, based on the current value of their portfolio and their withdrawal needs, are comfortable taking the risks associated with a 20/80 equity/fixed income allocation. Suppose their advisor is approached by a tactical manager with a proven track record of protecting capital in turbulent markets. The manager offers a product with a base 60/40 allocation, but which has the ability to tactically go 100% to fixed income in the event of an equity crash. As a result, the product offers the return potential of a 60/40 portfolio, but with a downside risk profile more similar to that of a 20/80 portfolio. In this specific case, the 20/80 portfolio may be the appropriate benchmark since it is the alternative to which the client would compare the tactical solution**. Appropriate benchmarking sometimes requires not just considering the active manager's strategy but also considering the investor.
Sources: Yahoo Finance, iShares
See www.russell.com/indexes/documents/resear... for original Russell Investments article.
* For illustration purposes, the "quantitative model" is a simple momentum model where countries with a higher trailing 12-month return are deemed more attractive.
** There are many other factors that the couple should consider, such as the risks of tactical investing and the types of markets that this particular tactical product is most vulnerable in. More than likely, the couple should only put a portion of their portfolio in the tactical product given the current situation of the couple and the risk aversion inherent in that situation.
Disclosure: I have no positions in any stocks mentioned, and no plans to initiate any positions within the next 72 hours. I wrote this article myself, and it expresses my own opinions. I am not receiving compensation for it. I have no business relationship with any company whose stock is mentioned in this article.
See also Your Earnings Season Preview: U.S. Steel on seekingalpha.com
The views and opinions expressed herein are the views and opinions of the author and do not necessarily reflect those of Nasdaq, Inc.
The views and opinions expressed herein are the views and opinions of the author and do not necessarily reflect those of Nasdaq, Inc.

