Let’s start with the bottom line. This is a choppy market. To begin this update, we will focus on a few short-term technical characteristics in the markets right now and explore some broader market concerns. At the end of this update, we will discuss portfolio management and how to navigate the choppy waters of the markets.
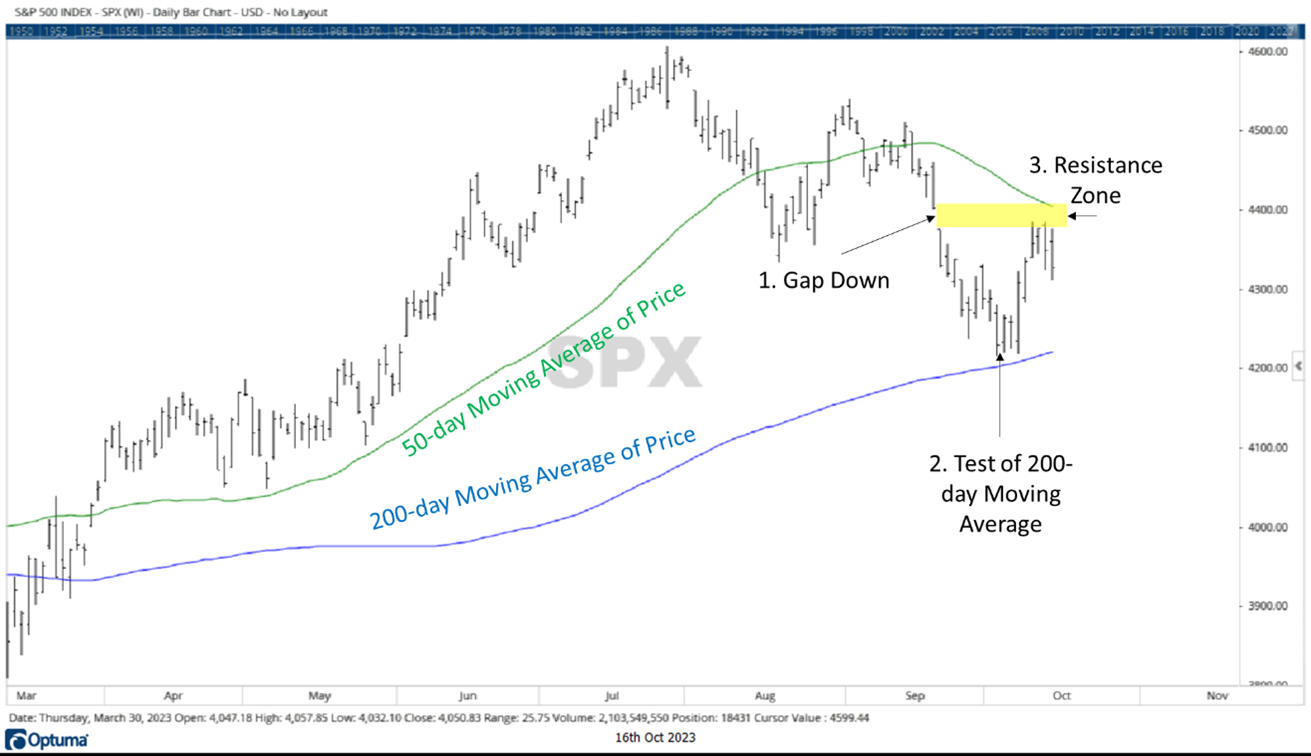
Here is a technical comment on the S&P 500, with a chart. This chart displays the current battle between supply and demand. In late September, at Point 1, the market experienced a “gap down.” This is a negative move that occurs when an index or security’s high for the day is below the previous day’s low point. A gap down usually indicates that there is some significant selling pressure at that price level. In this case, that price level is from $4,380 to $4,400. Following the gap down, the index continued to decline until it reached some support, or buying power, near its 200-day moving average of price and bounced upwards off this moving average (Point 2). Now, the index is attempting to “fill the gap,” or break back above the pricing level where the gap down occurred. So far, this has been a significant point of contention for buyers and sellers.

Large Cap Stocks
Let’s look at some broader market concerns. It is important to point out that the S&P 500 is a “capitalization-weighted” index. “Capitalization,” or “market cap” is simply a security’s number of shares outstanding multiplied by its price. In a capitalization-weighted index, the largest stocks have a greater impact on overall fluctuations. In the case of the S&P 500, the largest seven stocks make up for more than a quarter of the index’s movements. In other words, the S&P 500 is an index composed of 505 individual securities, but is heavily influenced by just seven of them, which are all technology related. These seven stocks have masked a lot of market weakness.
Of the largest seven company stocks (Apple, Microsoft, Amazon, Nvidia, Google, Tesla and Meta), the median returner is up 55% on the year. Each of these stocks also saw significant declines in 2022. The performance of these stocks has greatly exaggerated the health of the markets. While these stocks are up significantly this year, an equal weighted S&P 500 index is flat, meaning that the average S&P 500 stock has gone nowhere.
Small Cap Stocks
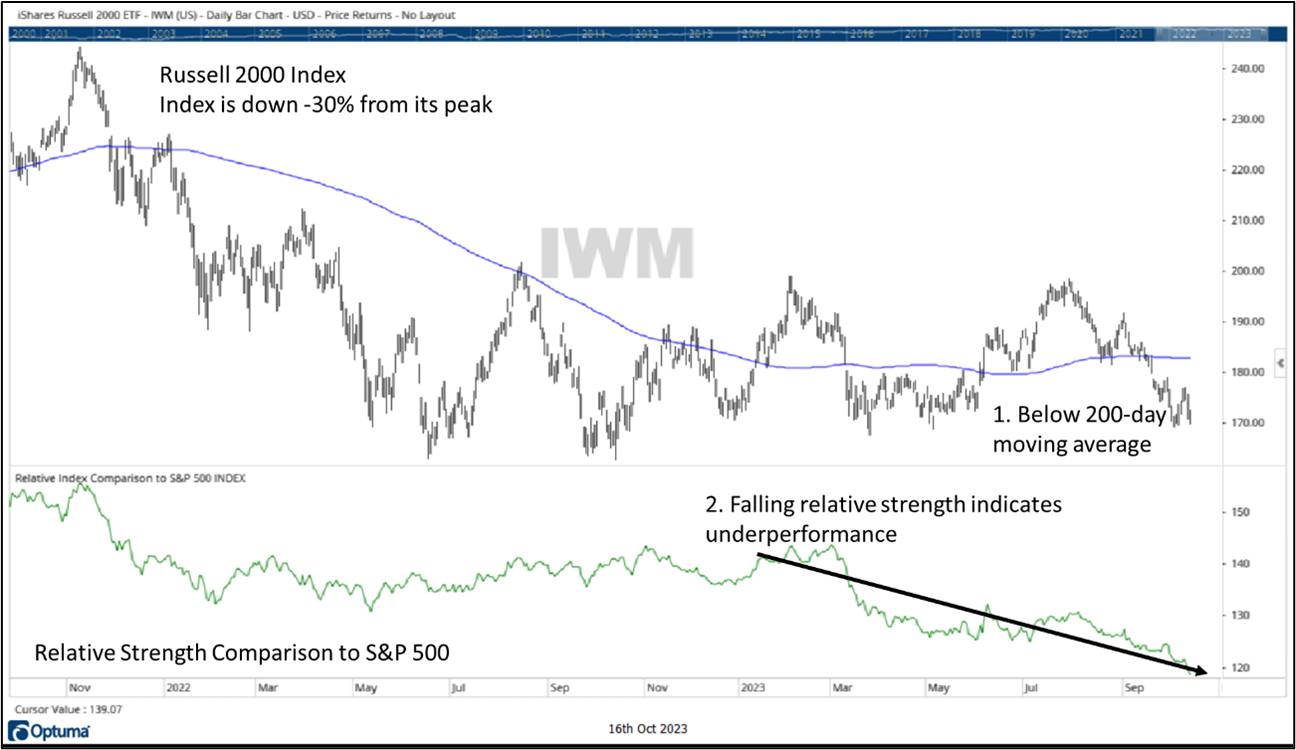
The S&P 500 only measures the largest capitalized stocks. If we look at a broader basket of securities, such as the smaller capitalized company stocks that make up the Russell 2000, stocks are looking even more bleak.
Look at the chart of the Russell 2000 below. Small cap stocks are in a long-term bear market, down -30% from their peak. Recently, the index broke below its 200-day moving average of price, which is typically bearish (Point 1). The lower half of the chart shows the index’s relative strength to the S&P 500. When this line is increasing, it means that on a relative basis, small cap stocks are outperforming their large cap counterparts. As you can see, the relative strength of the Russell 2000 is declining, and has been declining for all of 2023. So, this index has been much weaker than the S&P 500 (Point 2). As a matter of fact, the Russell’s relative strength is at its lowest point since 2002.

Portfolio Management
At the beginning of this update, we said that we would talk about a few technical characteristics as well as broader market concerns. We know that the average large cap stock is not doing that well, and smaller securities are doing even worse. Although not discussed in this update, we know that bonds have had a negative impact on the conservative investor. In fact, due to rising interest rates, long-term treasury bond fund prices are now at their lowest level since 2008 (TLT). Given that the average stock is in choppy waters and that bonds are not offsetting market risks, let’s talk about portfolio management.
What is benefitting in this “choppy” market environment? Most broad market sectors, outside of Communications and Energy, look technically weak. Fortunately, if we dig into some individual stock securities, there are charts that look good right now. There are also ways to manage portfolio risks outside of the traditional methods.
Here is how Canterbury is constructing a low volatility portfolio during this risky market environment:
- Owning stronger market sectors. A sector like Energy has been one of the better S&P 500 sectors to own recently. Additionally, the Communications sector has also been strong. Canterbury’s Adaptive Portfolio holds positions in these sectors.
- Holding a few inverse securities. Canterbury holds a few inverse securities that move in the opposite direction of their underlying index. Meaning, if the Real Estate sector drops by -1.50%, its inverse would be up +1.50%. These securities naturally have negative correlation to the market and can reduce both risk and portfolio volatility when utilized correctly.
- Selecting individual stocks. Canterbury has positions in some individual stocks. For instance, the Consumer Staples sector has looked bad this year. One stock in that sector that has a better-looking chart is Costco. Rather than having a position in Consumer Staples, Canterbury has held Costco for the last few months, and has taken some additional stock positions. It’s important to note that while these stock charts might look good today, if they begin to exhibit more negative characteristics, an adaptive portfolio will rotate its holdings.
- Avoiding Bonds. There is no question that bonds are in a bear market. From its peak in 2020, a twenty-year treasury bond ETF (TLT) is down -40%. A shorter, 7–10-year, treasury bond ETF (IEF) is down -25% from its 2020 peak. If interest rates continue to climb, the value of bond funds will continue to fall.
At Canterbury, we believe that investment portfolios should be adaptive. A portfolio should move in concert with changing market environments. As market conditions change, a portfolio’s holdings and diversification should adjust to keep the portfolio comfortable.
Right now, Canterbury’s adaptive portfolio is situated to have low volatility. We know that markets are vulnerable right now, and outside of a few large technology stocks, have been choppy this year. Our adaptive portfolio holds some sector and industry ETFs, as well as a few individual company stocks. To help manage potential market risks and declines, it holds a few inverse securities in some of the weaker market segments. The goal is to benefit from potential market volatility, and not be punished by it.
The views and opinions expressed herein are the views and opinions of the author and do not necessarily reflect those of Nasdaq, Inc.
