
Perhaps the most basic questions for any investor are “When should I buy?” and “When should I sell?” In general terms, the best answers to those questions are probably “now” and “never,” but most want to at least try to give themselves an edge and a better overall return than the market, so look to time the market to some extent for part of their portfolio. Identifying potential turbulence and then doing nothing creates a bad feeling and can lead to bad decisions driven by frustration, and I feel that way right now. But should I be acting on that, or will stocks keep moving higher? I can’t know for sure, but there is a process that investors can use to identify when things are likely to turn around.
If you have been reading my contributions here regularly this week, you may know that I am a bit bearish right now and am a little worried about stocks over the next few months. That is an unusual feeling for me. I am always bullish in the long-term, for the simple reason that over periods measured in decades, stocks move higher. There has never been a twenty-year rolling period in which the S&P 500 has fallen, so long-term investors who maintain a diversified portfolio or invest in index funds to minimize the impact of a single company’s performance always make money. The fact that this truth underpins my analysis also makes me tend towards bullishness in the short-term. If the default direction over time is upwards, then drops are an aberration by definition, and are always buying opportunities.
That all sounds simple enough, but there are two catches.
First, for most people, in order to buy in a meaningful way on a drop in the market, you have to free up some cash by selling, either before the decline begins or not long after it does. That means you have to identify when stocks are about to fall, or are falling in a way that goes beyond the normal levels of volatility. The first step in doing that is fundamental analysis. The two biggest driver of the stock market as a whole are, by far, current and projected economic conditions. The market goes up in good times and down in bad, so you need to stay abreast of economic data and trends, and what they probably mean for future growth, so that you have a generalized view of what to expect. Should that analysis indicate possible trouble ahead, as mine does at the moment, you might consider selling.
Secondly, once the move down is underway, you have to decide where to start buying back. Both of those things are hard to do because they involve going against a trend -- selling into a bull market and then buying into a bear.
That is when I turn to charts and technical analysis. I am not talking here about using some obscure “system” to identify moves before they happen, the kind of thing you might be promised by an unsolicited email that uses breathless language to tell you that you, too, could be a millionaire within a few months! There is no such system, and if there were, ask yourself why would the person who “discovered” it tell you about it for a fee, rather than just use it to get fabulously wealthy themselves?
No, I am talking about identifying obvious or commonly-used levels on a chart, the kind of thing that a lot of traders rely on, then understanding what the likely reaction of those traders will be. If enough traders see certain levels as important, then they are important because their actions when those levels are reached have an impact. If enough people see a level as a likely bottom, and buy there as a result, that buying will make it a bottom anyway. And if enough identify a potential top and sell, that will be the top, at least for a while.
In that way, good technical signals are basically self-fulfilling prophecies, but only when enough people pay attention to them. The most effective chart analysis, therefore, follows the KISS (keep it simple, stupid) principle, and the simplest indicator of all is a previously significant level. Right now, for example, the S&P 500 is trading right around a level (4200) at or fairly close to which the index has changed direction half a dozen times over the last two years:
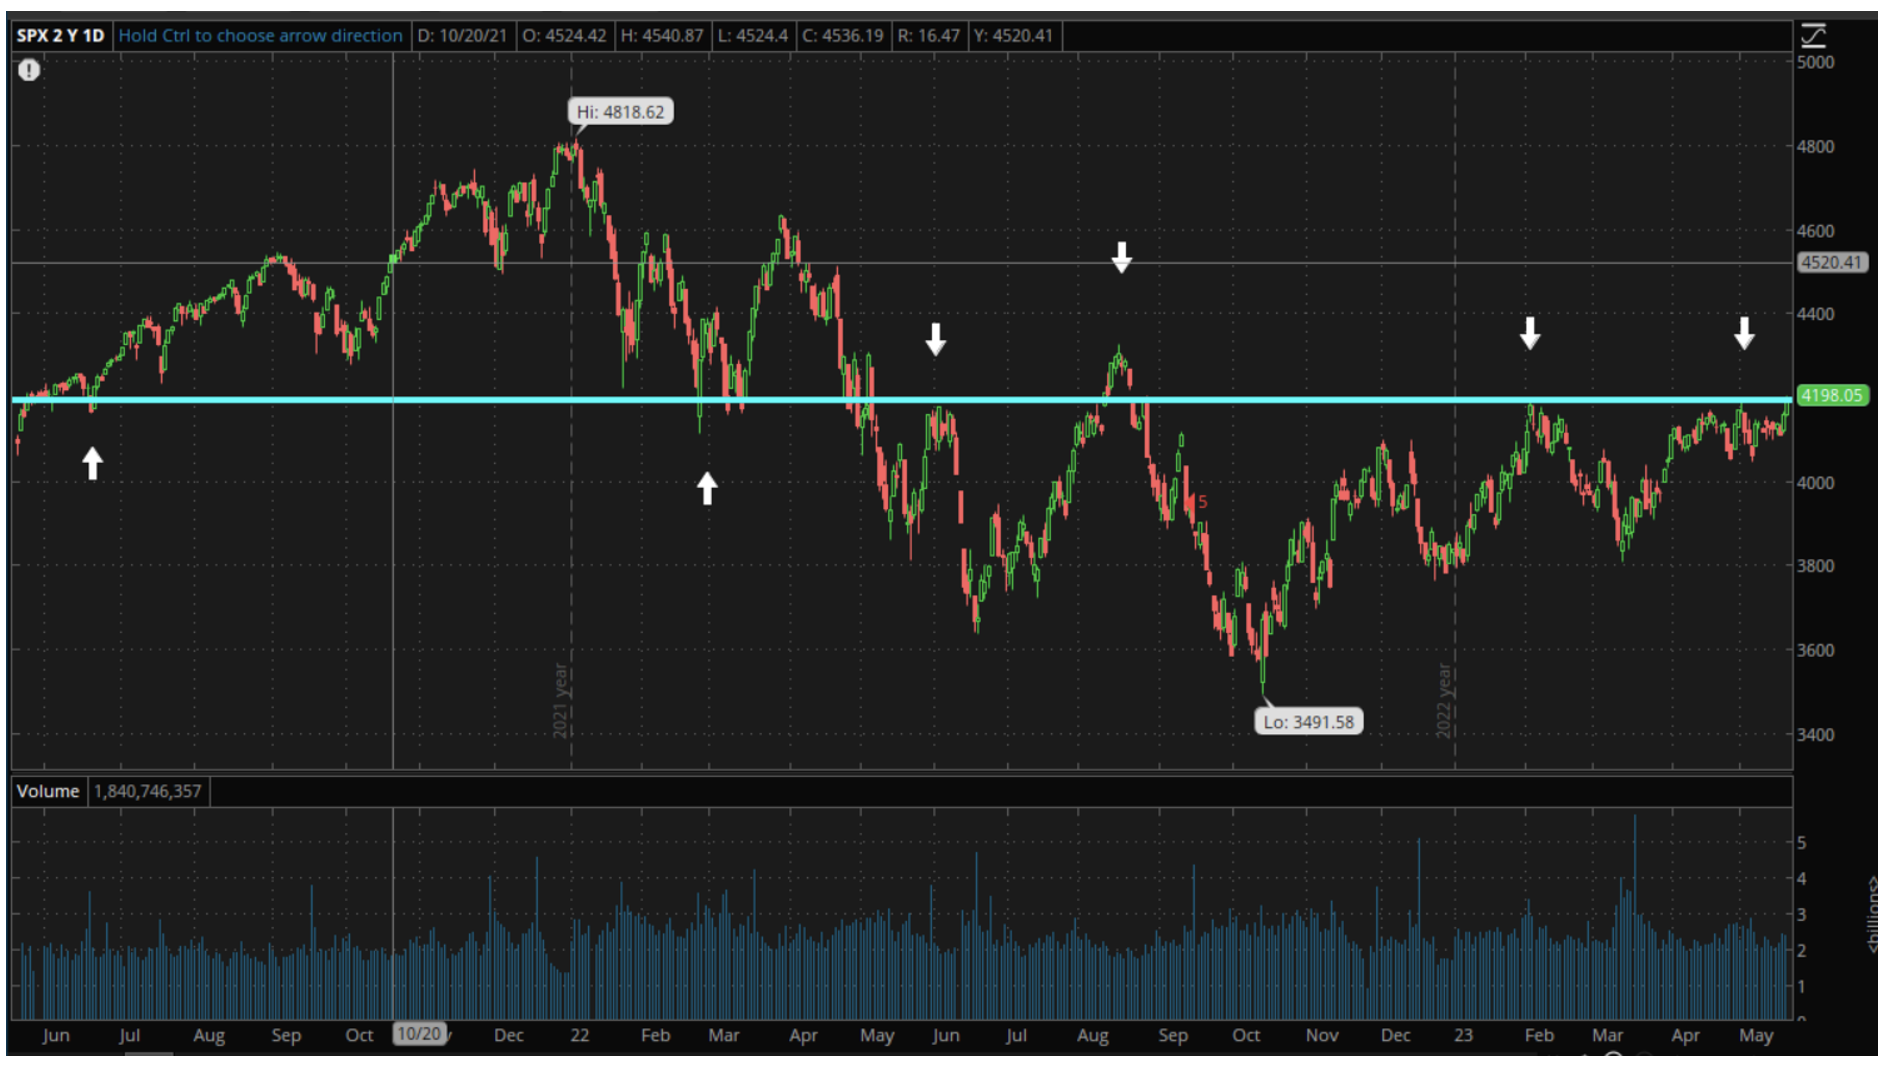
That could have started out as merely a coincidence, with economic conditions and prospects changing at those times, regardless of where the S&P was. However, each time the index turns at or close to that 4200-4300 level, it becomes more significant. As we are now at that level and my view based on fundamentals is that we will turn lower before long, I have been trimming positions over the last few days, freeing up some cash to use should that be the case. If it is, then I will use a similar process to decide when to start buying again, starting with fundamental analysis, then using the chart to decide where to do so.
There is an important point to be made here, though. Even if your analysis is perfectly logical and the chart suggests that your timing is right, there will be times when you are wrong. If, for example, the S&P 500 continues higher next week or consolidates above 4300, I will be wrong this time, and will buy back what I have been selling over the last few days. That will have cost me a small amount as a percentage of my portfolio but will have done no real damage to my overall position. To me, that is a small price to pay for the chance to get it right, and I will continue to use a combination of fundamental and technical analysis to attempt to identify when the next drop is coming.
Deciding when to sell and when to buy back is the essence of active self-directed investing, so most people think it is the most difficult thing to do. However, if you trust your analysis, follow a process, use obvious levels, and then allow for the fact that you might be wrong, deciding when to free up some cash and when to redeploy it is not that hard, and is something that can increase overall returns but won’t throw you off from your long-term goals.
The views and opinions expressed herein are the views and opinions of the author and do not necessarily reflect those of Nasdaq, Inc.

Martin Tillier
Martin Tillier spent years working in the Foreign Exchange market, which required an in-depth understanding of both the world’s markets and psychology and techniques of traders. In 2002, Martin left the markets, moved to the U.S., and opened a successful wine store, but the lure of the financial world proved too strong, leading Martin to join a major firm as financial advisor.
Read Martin's Bio