
How Much Tighter Will Odd-Lot Spreads Be?
We know from previous studies that round-lot rules force spreads wider, especially for high-priced stocks. However, we also know that those same high-priced stocks are much more likely to have better odd-lot quotes inside the NBBO.
Essentially what we have is a “round-lot problem.” But exactly what does the round-lot constraint do to spread costs for investors?
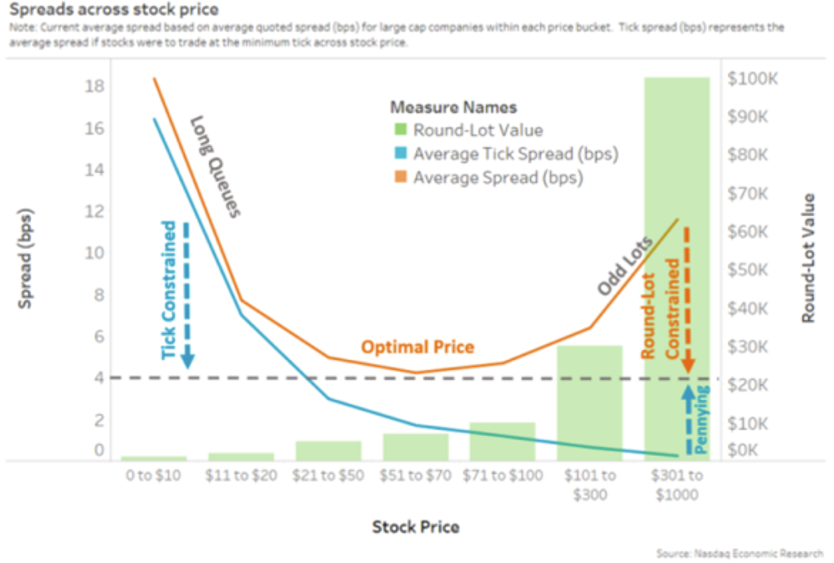
Chart 1: Spreads form a U-shape as stock prices rise, impacted by tick size and round-lot sizes
We have looked at what might happen to depth if we eliminated round lots. Today we look at what might happen to spreads if we eliminated round lots by looking at the odd-BBO (oBBO) in greater detail.
Large-cap spreads might only improve 40%
Looking at the actual data for large-cap stocks, we see that even though the minimum tick, the cost of a 1-cent spread, falls to very close to zero in basis points (blue line), we see NBBO spreads form a U-shape (orange line, Charts 1 and 3).
The reason spreads widen even when the tick is falling is the impact of the round-lot constraint (green bars).
Why does this happen?
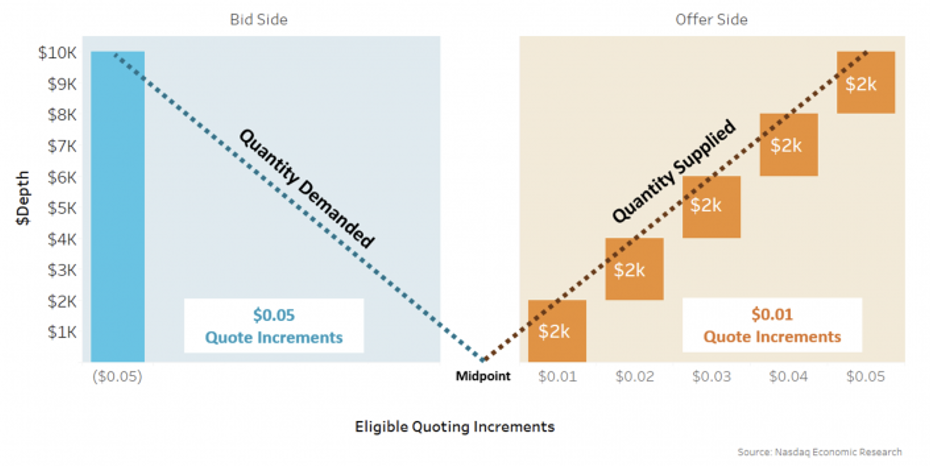
We know from other studies that supply and demand accumulate in a V-shape. Based on the V-shaped economics of supply and demand and spreads (Chart 2), spreads change proportionately to depth changes. The more spread you can make, the more liquidity will be provided, and vice versa.
But our one-size-fits-all tick combined with our one-size-fits-all round lot creates two opposite dynamics:
- Tick constraint: For low priced stocks, the economic cost of the 1-cent tick falls (blue line in Chart 1). That allows spreads to tighten, but as that happens, you slide down the V (orange examples below), and depth also falls.
- Round-lot constraint: Later, as stock prices rise more, the value required to post a round lot rises (green bars above). That means more supply is required to set NBBO, and as a result, you slide up the V, and the spread widens (blue example below).
Chart 2: Liquidity supply is V-shaped—As spreads tighten, depth falls, and vice-versa
In theory, eliminating round lots should mean the NBBO could form on 1-share orders which have 1/100th the exposure. Consequently, spreads could be as small as 1/100th of the current NBBO for very high-priced stocks.
However, the oBBO data suggests that’s not true (Chart 3).
In fact, even for the highest-priced stocks, the oBBO averages just 40% tighter than the NBBO. More importantly, we mostly see the oBBO still forming a (flatter) U-shape.
This seems important. It highlights that even if ticks become infinitesimally small, liquidity providers seem to know a certain spread is required to balance spread capture from setting public prices against adverse selection and queue jumping. For large-cap stocks, that average seems to be around 6 basis points.
Chart 3: Large-cap NBBO and oBBO vs. the minimum tick

There are still a lot of ticks in between even the odd-BBO
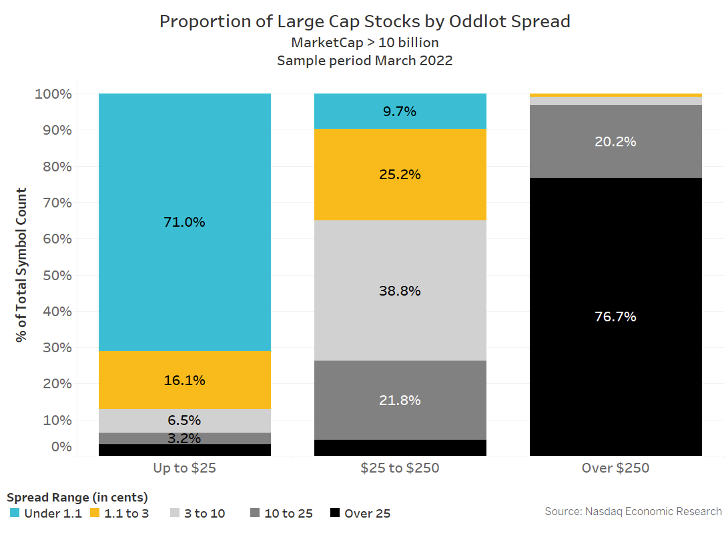
This data also has implications for some results we shared recently on how tick size matters. Using the same groupings as we used in that study, we see that, even with an oBBO, there are only four large-cap stocks priced above $250 with an oBBO spread less than 10-cents wide.
Even for stocks priced from $25-$250, more than 65% of stocks trade with an oBBO spread wider than 3 cents – considered by researchers to be the“optimal” spread.
Chart 4: Proportion of large-cap stocks trading with a tick-constrained, or multi-tick, oBBO
Even mid-cap stocks see the same thing
We know from previous research that spreads on smaller cap stocks are generally wider than large cap stocks spreads, thanks mostly to lower liquidity, resulting in less competition for quotes.
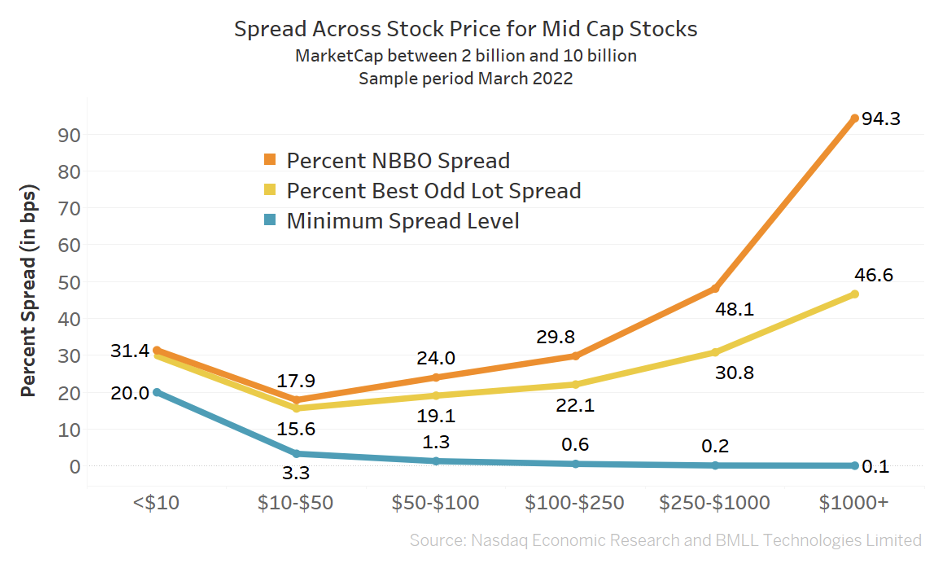
However, even in smaller stocks we see the same U-shape patterns in NBBO and oBBO spreads when we look at mid-cap stocks (Chart 5). The data suggests the oBBO spread would be around 50% better than the NBBO for the very high-priced midcap stocks, leaving those stocks still multiple ticks wide.
We also see that the oBBO spread doesn’t improve much for mid-cap stocks priced below $100. Again—despite the tick size shrinking—oBBO spreads don’t get much tighter.
That indicates that the economic spread required to attract quotes to these smaller stocks is at least 15 basis points.
Chart 5: Mid-cap NBBO and oBBO vs. the minimum tick
Why is this important?
We can see from these results that even if you make tick sizes or round-lot values very small, spreads don’t keep getting cheaper.
In fact, the U-shaped oBBO curve is more evidence that perfect stock prices exist and that it happens when stocks trade around 2-ticks wide. That seems to be where a tick represents enough of an economic cost to make queue-jumping costs meaningful, and spread capture sufficient to offset adverse selection, resulting in the most competitive public quotes.
And as we know: Competitive public quotes are good for all kinds of investors.
BONUS: First look at AMZN’s stock split
On a related topic that includes data about stock prices, odd lots, and right-sizing spreads in ticks – this week, Amazon (AMZN) stock split 20:1.
That gives us a chance to see if what we observe above, where high-priced stocks have artificially wide NBBO and oBBO spreads, changes immediately when a stock trades closer to its perfect stock price. Turns out tradability immediately improved, and AMZN is already trading around its perfect stock price, where the markets spread is around 2 ticks wide.
Chart 6: Change in NBBO and oBBO spreads and value traded in AMZN post 20:1 split

In the month before the split, the average spread of AMZN was $2.20. So, a 20:1 split might lead you to guess that the spread would be 1/20th of the current spread, or 2.20/20 = 11 cents. However, the stock is already trading with a spread of 2.2-cents, a reduction of 99%, even better than 95% expected due to a 20:1 split ratio. As a result, the:
- NBBO spread cost (in basis points) has fallen by 77%, from a pre-split average of 9.7 basis points to 2.2 basis points (Orange line).
- oBBO spread cost has also fallen by a slightly lower 70%, from a pre-split average of 6.2 basis points to under 1.9 basis points (Yellow line).
- Liquidity is slightly better, with AMZN averaging $11.8 billion each day, just above the pre-split average of $11.4 billion.
Measuring relative stock returns around the split is proving to be trickier, as Amazon has been caught up in a broad retail sell-off caused by market-moving retail inventory news from Target and Walmart, showing that consumers are shifting quickly to services spending now that Covid restrictions are being lifted.
In short, what we see so far confirms what we know from prior studies. Trading costs and complexity are significantly improved, which also results in improvements in liquidity. Over time, that should reduce Amazon’s cost of capital.
In This Story
AMZN
Phil Mackintosh
Nasdaq
Phil Mackintosh is Chief Economist and a Senior Vice President at Nasdaq. His team is responsible for a variety of projects and initiatives in the U.S. and Europe to improve market structure, encourage capital formation and enhance trading efficiency.
Read Phil's Bio