For all of its natural beauty, warm weather, ocean-side vistas and rich, diverse culture, California also comes with what sometimes seems like almost impossible cost of living — dizzyingly high real estate rates and rental prices and crime levels that can spook all but the most hardened of city folks. As such, the idea of living in one of The Golden State’s largest cities can be more than a little daunting, as such a move comes at a rather high cost (especially for middle class incomes).
Find Out: 10 Things the Middle Class Won’t Be Able To Afford in Less Than a Decade
Learn more: How Much Money Is Needed To Be Considered Middle Class in Every State?
That said, those with a love for big-city life and weekends on the beach may wish to try their hand at California living despite its expensive costs. With that in mind, GOBankingRates has assembled a cost breakdown of California’s nine largest cities — taking into account the median middle-class income level of each city, contrasting that against annual cost of living for homeowners and renters alike and revealing the amount of surplus (or even deficit) income for those homeowners and renters.
Many of California’s largest cities are so expensive that the median income is simply not cost effective or affordable to rent or own a home; however, for middle-class folks brave enough to navigate California’s spiking home costs and rental rates, one of these cities may be just right for you.

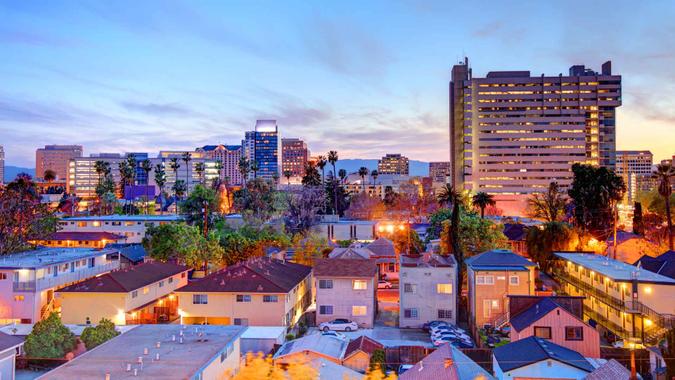
San Jose
- Median income: $136,010
- Annual cost of living for homeowner: $135,144
- Surplus/deficit of income for median middle-class homeowner: -$59,995
- Annual cost of living for renter: $69,300
- Surplus/deficit of income for median middle-class renter: $5,849
Explore More: 20 Best Cities Where You Can Buy a House for Under $100K
Check Out: The Salary Needed To Afford America’s 50 Biggest Cities

San Francisco
- Median income: $136,689
- Annual cost of living for homeowner: $128,373
- Surplus/deficit of income for median middle-class homeowner: -$53,224
- Annual cost of living for renter: $72,622
- Surplus/deficit of income for median middle-class renter: $2,527
Discover More: The 30 Safest and Richest US Cities To Live in 2024

San Diego
- Median income: $98,657
- Annual cost of living for homeowner: $106,013
- Surplus/deficit of income for median middle-class homeowner: -$30,864
- Annual cost of living for renter: $63,537
- Surplus/deficit of income for median middle-class renter: $11,612

Los Angeles
- Median income: $76,244
- Annual cost of living for homeowner: $98,938
- Surplus/deficit of income for median middle-class homeowner: -$23,789
- Annual cost of living for renter: $62,975
- Surplus/deficit of income for median middle-class renter: $12,174

Long Beach
- Median income: $78,995
- Annual cost of living for homeowner: $90,817
- Surplus/deficit of income for median middle-class homeowner: -$15,668
- Annual cost of living for renter: $55,711
- Surplus/deficit of income for median middle-class renter: $19,438

Oakland
- Median income: $94,389
- Annual cost of living for homeowner: $86,365
- Surplus/deficit of income for median middle-class homeowner: -$11,216
- Annual cost of living for renter: $58,182
- Surplus/deficit of income for median middle-class renter: $16,967
Also See: What Is the Median Income for the Upper Middle Class in 2024?

Sacramento
- Median income: $78,954
- Annual cost of living for homeowner: $60,681
- Surplus/deficit of income for median middle-class homeowner: $14,468
- Annual cost of living for renter: $51,629
- Surplus/deficit of income for median middle-class renter: $23,520

Bakersfield
- Median income: $73,827
- Annual cost of living for homeowner: $52,285
- Surplus/deficit of income for median middle-class homeowner: $22,864
- Annual cost of living for renter: $48,053
- Surplus/deficit of income for median middle-class renter: $27,096

Fresno
- Median income: $63,001
- Annual cost of living for homeowner: $52,234
- Surplus/deficit of income for median middle-class homeowner: $22,915
- Annual cost of living for renter: $48,239
- Surplus/deficit of income for median middle-class renter: $26,910
Methodology: For this study, GOBankingRates analyzed the top 50 cities by population according to the U.S. Census 2023 American Community Survey. For each city, the following factors were found: total population, population ages 65 and over, total households and household median income, all sourced from the U.S. Census American Community Survey. Cost-of-living indexes were sourced from Sperling’s BestPlaces. These include grocery, healthcare, housing, utilities, transportation and miscellaneous cost of living indexes. Using the cost-of-living indexes for grocery, healthcare, utilities, transportation and miscellaneous, as well as the national average expenditure costs, as sourced from the Bureau of Labor Statistics Consumer Expenditure Survey, the average expenditure cost for each location was calculated. Next, the average single-family home value was sourced from the Zillow Home Value Index for September 2024. Using the average single-family home value, assuming a 10% down payment and using the most recent national average 30-year fixed mortgage rate, as sourced from the Federal Reserve Economic Data, the average mortgage was calculated. Using the average mortgage and average expenditure costs, the average total cost of living was calculated. Next, using the definition of middle-class income from the Pew Research Center, which defines the middle-class range as two-thirds to double the national median income, the middle-class income range for each city was calculated. Using the minimum, median and maximum income a middle-class household could earn, as well as the total cost of living for each location, the leftover income or additional income needed was calculated. The cities were sorted to show the places where a middle-class household is the most priced out, showing how far a typical middle-class household income goes in the largest U.S. cities. All data was collected on and is up to date as of Nov. 5, 2024.
More From GOBankingRates
- 4 Low-Risk Accounts Financially Savvy People Trust for Reliable Returns (And How You Can Use Them)
- 5 Cities Where Homes Will Be a Total Steal in 2 Years
- 4 Subtly Genius Moves All Wealthy People Make With Their Money
- 5 Money Moves Wealthy People Make Before the Start of Any New Year
This article originally appeared on GOBankingRates.com: How Far Does a Middle-Class Salary Go in California’s Largest Cities?
The views and opinions expressed herein are the views and opinions of the author and do not necessarily reflect those of Nasdaq, Inc.


