
Anticipate, Monitor, and Adjust
Over the last several months, see our last update here, we found using our Elliot Wave Principle (EWP) count that Ethereum (ETHUSD) was most likely gearing up for a rally to $4800-5400. We tracked it as a standard impulse pattern “contingent on holding above key price levels because there are no certainties. Only probabilities.”
On Monday, May 20th, the second-largest cryptocurrency by market cap rallied strongly but has since given up most of those gains. See Figure 1 below. Hence, Ethereum failed to hold above several key price levels we had laid out, so we must adapt our preferred POV. Allow us to explain below.
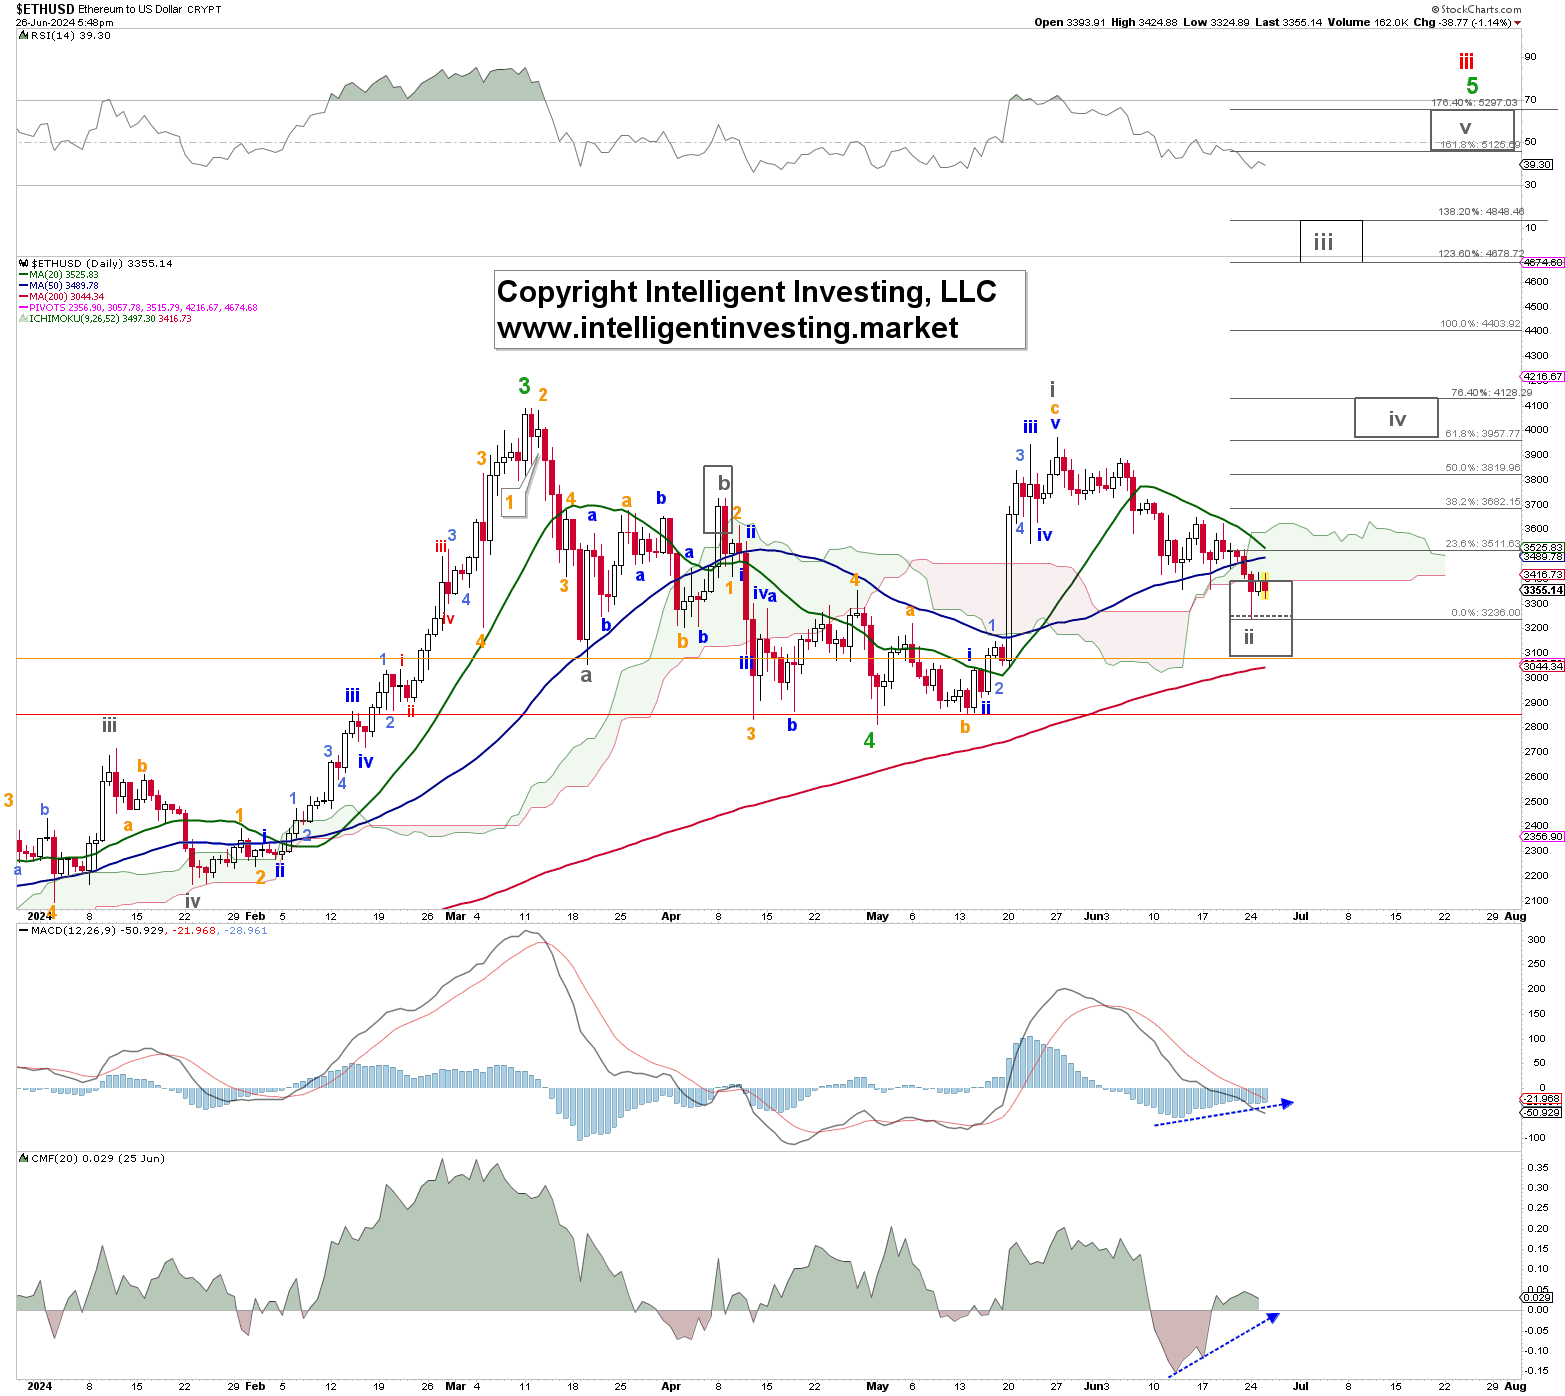 Figure 1. The daily resolution candlestick chart of ETH with several technical indicators
The “dreaded” Ending Diagonal
The rally from the green W-4 low made on May 1 now counts best as three (orange a, b, and c) waves up. In ending diagonals (ED, see here). The ending diagonal is a special type of wave that can occur in Wave 5 of an impulse. The wave structure of an ED is different from that of the impulse wave. Where the impulse wave had a general structure count of 5-3-5-3-5, the ending diagonal most often has a structure count of 3-3-3-3-3. All five waves of an ED break down to only three waves each, indicating exhaustion of the larger degree trend. Also, Wave 1 and Wave 4 may overlap with each other.
Thus, the current rally and decline could be (grey) W-i and W-ii of the (green W-5), contingent on holding above the orange and red horizontal warning levels. Namely, second waves, also in an ED, tend to bottom out around a 50.0-76.4% retracement of the preceding same-degree 1st wave. On Monday, ETHUSD reached the 61.80% retracement and—so far—bounced off it. Thus, although Ethereum can move even a bit lower to ~$3045, it should not move much below it to keep the ED pattern alive. A break above the (blue) 50-day Simple Moving Average and its Ichimoku Cloud can trigger the grey W-iii, iv, v per the Fibonacci-target zones, as shown.
Meanwhile, positive divergences (blue dotted arrows) are forming, suggesting exhaustion of the current downtrend, but it is a condition, not a trigger. Suppose the Ethereum Bulls fail to show up over the next few days. In that case, they risk a breakdown to as low as $2900+/-200 before starting their next attempt for that rally to $4800-5400. Namely, we remain long-term Bullish on this cryptocurrency, which started its Bull run towards ideally $10+/-2.5K in 2022, contingent on holding above $2150.
This article was originally posted on FX Empire
More From FXEMPIRE:
- Gold Price Forecast: Triggers Weekly Breakdown
- Hang Seng Index, Nikkei Index, ASX 200: Tech Sector Rout and China Woes
- S&P 500 Price Forecast – S&P 500 Continues to See Overall Uptrend Despite Pullback
The views and opinions expressed herein are the views and opinions of the author and do not necessarily reflect those of Nasdaq, Inc.

