
 Credit: Purple Background
Devoted to information and portfolio strategies for the high relative strength asset class
What’s Hot…and Not
How different investments have done over the past 12 months, 6 months, and 1 month. As of 12/13/18:

Past performance is not indicative of future results.
Never before has it been easier for investors to invest in the strongest trends wherever they might be found in the world. Relative strength offers a disciplined framework for allocating among those trends. Markets are global and your portfolio should be too.
See disclosures in Appendix A, which includes the ETFs and Indexes used for this performance table.Performance numbers include dividends but do not include all transaction costs. Investors cannot invest directly in an index. Indexes have no fees. Past performance is not indicative of future results. Potential for profits is accompanied by possibility of loss.
High RS Asset Class
High RS stocks, as an asset class, often move independently of broad indexes. As of 12/13/18:

See disclosures in Appendix A.
Fund Flows
Total estimated inflows to long-term mutual funds and net exchange traded fund (ETF) issuance collected by The Investment Company Institute.
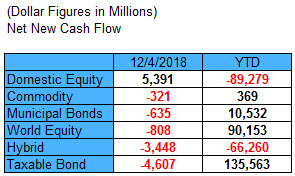
See disclosures in Appendix A.
Sector and Capitalization Performance

Past performance is not indicative of future results.
See disclosures in Appendix A.
High RS Diffusion Index
As of 12/13/18:

This index has rebounded after falling to a recent one-day low of 12% on 10/26/18. Dips in this index have often provided good opportunities to add to relative strength strategies. The 10-day moving average of this index is 60% and the one-day reading is 61%.
See disclosures in Appendix A.
Relative Strength Spread
The chart below is the spread between the relative strength leaders and relative strength laggards (universe of mid and large cap stocks). When the chart is rising, relative strength leaders are performing better than relative strength laggards. As of 12/13/18:

The RS Spread has been unevenly rising since mid-July of this year, reflecting the relative outperformance of RS leaders vs. RS laggards.
See disclosures in Appendix A.
The Role of Cash in Systematic RS Growth
A fully-invested equity strategy or an equity strategy that has the ability to raise cash---which is better? Which is better will depend on the time frame and the risk tolerance of the individual client, but we would suggest that there may be a place for both in a client's asset allocation. A fully-invested equity strategy will likely be more volatile, have deeper drawdowns, but may also perform better in certain time periods than a strategy that has the ability to raise cash. A strategy that has the ability to raise cash can offer clients greater staying power because of knowledge that risk management is a key objective of the strategy. In our family of Systematic Relative Strength (RS) portfolios, we have some fully invested portfolios and some that raise cash.
The chart below is based on Nasdaq Dorsey Wright's opinion of the likely relationship between volatility and return relationships between each of the different strategies over a long period of time. Actual results may differ from these expectations. Greater volatility may result in greater gains and greater losses.

Our Systematic RS Growth portfolio is a portfolio that has the ability to hold up to 50% cash if necessary. See below for some frequently asked questions about how this ability to hold cash works:
Q: How do you determine when to raise cash in the portfolio?
A: We employ a trend following equity guideline that keeps the portfolio fully-invested when equity markets are trending higher. However, when broad equity markets move into a declining trend, the guideline will start increasing the amount of cash to be held in the portfolio. The further that the market moves from its highs, the more cash will be called for in the portfolio. However, there is one twist to this process. We raise cash in the portfolio if two things happen: (1) the model calls for increasing the cash position and (2) one or more of our current holdings has deteriorated sufficiently from a trend and relative strength perspective to be sold. Basically, if a stock moves out of the top half of our ranks, moves below 3 technical attributes, or moves into a negative trend on a Point & Figure chart, the stock will be sold. See below for the historical cash allocation in the Growth portfolio:
Source: Dorsey Wright. As of 10/31/18. Estimate based on monthly cash values of a sample Growth portfolio.

Q: How do you determine when to reinvest the cash?
A: The trend following equity guideline will call for reinvesting the cash when the broad market moves off its lows. The further it moves from its lows, the less cash will be called for in the portfolio until the point when the account is once again fully invested.
Q: How has this portfolio performed over time?
A: Since inception of 12/31/2006 through 11/30/2018, the Systematic RS portfolio has outperformed the S&P 500 Total Return Index 8.92% to 8.02% net of all fees---with a beta of 0.81.
As of 11/30/2018. Net performance shown is total return net of management fees, commissions, and expenses for all Nasdaq Dorsey Wright managed accounts, managed for each complete quarter for each objective, regardless of levels of fixed income and cash in each account. The advisory fees are described in Part 2A of the adviser’s Form ADV. Past performance does not guarantee future results. In all securities trading, there is a potential for loss as well as profit. It should not be assumed that recommendations made in the future will be profitable or will equal the performance as shown.
Q: How can I access the Systematic RS Growth portfolio for my clients?
A: The Systematic RS Growth portfolio is available at Stifel, Envestnet, Kovack, RBC, Pershing, and for RIAs at Schwab, Fidelity, and TD Ameritrade. If you would like to see it added to a SMA or UMA platform at your firm, please have your managed accounts department contact our team at 626-535-0630 or click here.
Dorsey, Wright & Associates, LLC, a Nasdaq Company, is a registered investment advisory firm. Neither the information within this email nor any opinion expressed shall constitute an offer to sell or a solicitation or an offer to buy any securities, commodities or exchange traded products. This communication does not purport to be complete description of the securities or commodities, markets or developments to which reference is made. The relative strength strategy is NOT a guarantee. There may be times where all investments and strategies are unfavorable and depreciate in value. Relative Strength is a measure of price momentum based on historical price activity. Relative Strength is not predictive and there is no assurance that forecasts based on relative strength can be relied upon. In all securities trading there is a potential for loss as well as profit. It should not be assumed that recommendations made in the future will be profitable or will equal previous performance. Investors should have long-term financial objectives. Past performance, hypothetical or actual, does not guarantee future results. In all securities trading there is a potential for loss as well as profit. It should not be assumed that recommendations made in the future will be profitable or will equal the performance as shown. Investors should have long-term financial objectives. Advice from a financial professional is strongly advised.
Media Center
Invesco DWA Momentum ETFs
Arrow DWA Funds and ETFs
First Trust DWA UITs and ETFs
AdvisorShares
Virtus Investment Partners
Dorsey Wright SMAs and UMAs
Dorsey Wright White Papers
Other Relative Strength Sources
Brush, John S. "Eight Relative Strength Models Compared." Journal of Portfolio Management (1986).
Berger, Israel, Moskowitz. "The Case for Momentum Investing." AQR Capital Management. 2009.
Jegadeesh and Titman. "Returns to Buying Winners and Selling Losers." Journal of Finance (1993).
O'Shaughnessy, James P. What Works on Wall Street. McGraw Hill, 1997.
Appendix A
The information contained herein has been prepared without regard to any particular investor’s investment objectives, financial situation, and needs. Accordingly, investors should not act on any recommendation (express or implied) or information in this material without obtaining specific advice from their financial advisors and should not rely on information herein as the primary basis for their investment decisions. Information contained herein is based on data obtained from recognized statistical services, issuer reports or communications, or other sources believed to be reliable (“information providers”). However, such information has not been verified by Dorsey, Wright & Associates, LLC (DWA) or the information provider and DWA and the information providers make no representations or warranties or take any responsibility as to the accuracy or completeness of any recommendation or information contained herein. DWA and the information provider accept no liability to the recipient whatsoever whether in contract, in tort, for negligence, or otherwise for any direct, indirect, consequential, or special loss of any kind arising out of the use of this document or its contents or of the recipient relying on any such recommendation or information (except insofar as any statutory liability cannot be excluded). Any statements nonfactual in nature constitute only current opinions, which are subject to change without notice. Neither the information nor any opinion expressed shall constitute an offer to sell or a solicitation or an offer to buy any securities, commodities or exchange traded products. This document does not purport to be complete description of the securities or commodities, markets or developments to which reference is made. Past performance is not indicative of future results. Potential for profits is accompanied by possibility of loss. You should consider this strategy’s investment objectives, risks, charges and expenses before investing. The examples and information presented do not take into consideration commissions, tax implications, or other transaction costs. Each investor should carefully consider the investment objectives, risks and expenses of any Exchange-Traded Fund (“ETF”) prior to investing. Before investing in an ETF investors should obtain and carefully read the relevant prospectus and documents the issuer has filed with the SEC. ETF’s may result in the layering of fees as ETF’s impose their own advisory and other fees. To obtain more complete information about the product the documents are publicly available for free via EDGAR on the SEC website (http://www.sec.gov).
The returns shown in the Sector and Capitalization Snapshot are price returns only.
1PowerShares DB Gold, 2MSCI Emerging Markets Index, 3DJ U.S. Real Estate Index, 4S&P Europe 350 Index, 5Green Haven Continuous Commodity Index, 6iBoxx High Yield Corporate Bond Fund, 7JP Morgan Emerging Markets Bond Fund, 8PowerShares DB US Dollar Index, 9iBoxx Investment Grade Corporate Bond Fund, 10PowerShares DB Oil, 11Barclays 20+ Year Treasury Bond, 12S&P 500 Index, 13PowerShares QQQ, 14Dow Jones Industrial Average
“High RS Index” is a proprietary Dorsey, Wright Index composed of stocks that meet a high level of relative strength. The volatility of this index may be different than any product managed by Dorsey, Wright. The “High RS Index” does not represent the results of actual trading. Clients may have investment results different than the results portrayed in this index. Performance for both the High RS Index and S&P 500 is price returns only.
What's Hot...and Not Disclosures
The performance above is based on total returns, but does not include transaction costs. This example is presented for illustrative purposes only and does not represent a past recommendation. Investors cannot invest directly in an index. Indexes have no fees. Past performance is not indicative of future results. Potential for profits is accompanied by possibility of loss.
High RS Asset Class Disclosures
The performance above is based on pure price returns, not inclusive of dividends or all transaction costs. This example is presented for illustrative purposes only and does not represent a past recommendation. Investors cannot invest directly in an index. Indexes have no fees. Past performance is not indicative of future results. Potential for profits is accompanied by possibility of loss.
Fund Flows Disclosures
This example is presented for illustrative purposes only and does not represent a past recommendation.
High RS Diffusion Index Disclosures
The index above is based on pure price returns, not inclusive of dividends or all transaction costs. This example is presented for illustrative purposes only and does not represent a past recommendation. Investors cannot invest directly in an index. Indexes have no fees. Past performance is not indicative of future results. Potential for profits is accompanied by possibility of loss.
Relative Strength Spread Disclosures
The index above is based on pure price returns, not inclusive of dividends or all transaction costs. This example is presented for illustrative purposes only and does not represent a past recommendation. Investors cannot invest directly in an index. Indexes have no fees. Past performance is not indicative of future results. Potential for profits is accompanied by possibility of loss.
The views and opinions expressed herein are the views and opinions of the author and do not necessarily reflect those of Nasdaq, Inc.

